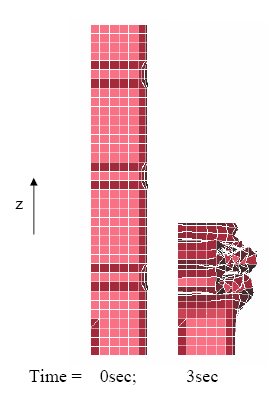
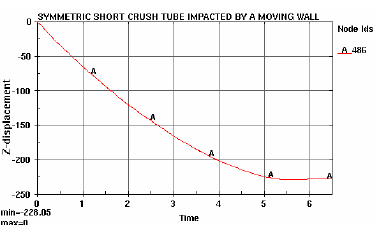
This example is a Monte Carlo analysis of a steel tube being crushed. The effect of both a variation in material thickness and a variation in the plastic stress-strain curve is investigated. The geometry is shown in the figure in its original and partially deformed state (Fig. 1(a)). The z-displacement of the upper tube boundary is also shown below as a history (Fig. 1(b)). The minimum value of the z-displacement is used as the response variable, and the response is compared to a crush distance of the selected normal design.
|

|
A scale factor (SIGY) is used to modify the plastic stress-strain curve. The binary LSDA LS-DYNA database is used for the extraction of the maximum displacement (largest negative value given in the direction of the z-axis, hence the MIN selection) response.

|
| Fig. 1(a) |
Fig. 1(b) |
Possible approaches for the problem solution