LS-OPT
Get a first look at LS-OPTui and the basic procedure of an optimization process.
Working Directory and Extraction of necessary files
- Create a working directory in the desired location to keep the main command file, input files and other command files as well as the LS-OPT program output.
LS-OPT user interface (LS-OPTui)
- On Linux, the user interface is launched with the command
lsoptui [command_file.lsopt]
- On Windows, the user interface is launched using
lsoptui.exe
A command file can be opened directly by drag and drop or by double-clicking on the .lsopt filename.
Project Details
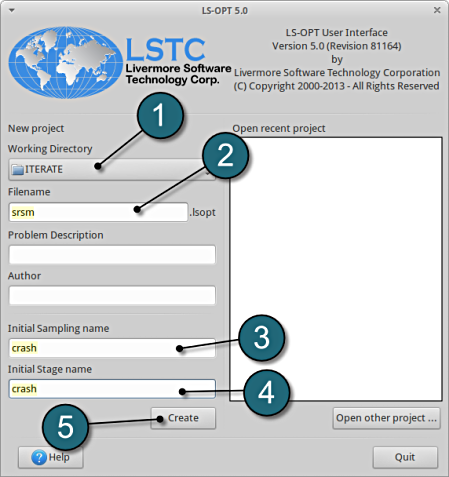
Open the graphical user interface of LS-OPT. Enter the required specifications, to generate an LS-OPT project file, by the following steps:
- Select the Working Directory of the LS-OPT project.
- Select a suitable name for the file under Filename. The extension .lsopt is appended by LS-OPT.
- Choose a suitable name under the Initial Sampling name.
- Choose a suitable name under the Initial Stage name.
- Press the Create button to initiate the formation of the input file.
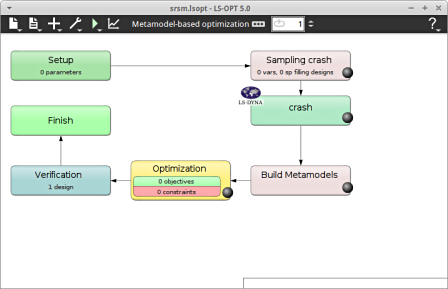
- The main GUI window of the LS-OPT emerges.
- The process flow of the selected optimization task is visualized.
- Selecting a perticular box opens the respective dialog.
Home Screen Process Flowchart
-
Select the icon
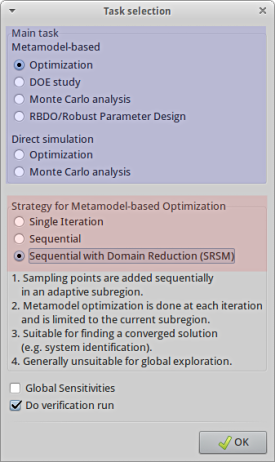
from the control bar of the main GUI window. A window Task selection shall open.
Define the Main Task
- The Main Task of LS-OPT can be selected among the several options available. Push the radio button for the corresponding task.
- The selection of the Strategy for Metamodel-based Optimization is made to any of the options. The Strategy selection is only available for Metamodel-based Optimization and RBDO/Robust Parameter Design.
- Single Stage: Sampling points are chosen only once and the whole design space is taken as the region of interest. Therefore no iteration is needed.
- Sequential: Sampling is done sequentially, only a small number of points are chosen for each iteration.
- Sequential with Domain Reduction: It is the same as the Sequential Strategy, but in each iteration the domain reduction strategy is used to reduce the size of the region of interest.
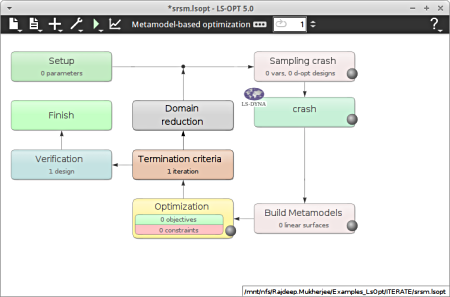
- The LS-OPT main GUI window visualizes the process of the selected task and strategy.
Home Screen Process Flowchart
- Select the already available Stage box in the process flow (here crash).
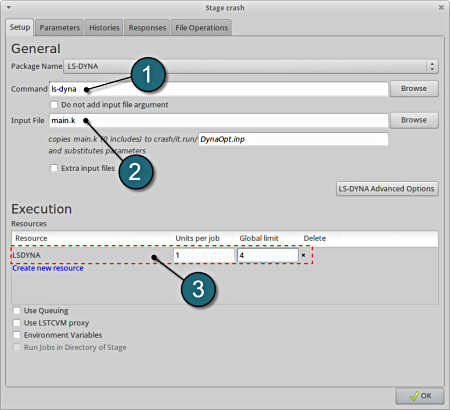
A window Stage stagename shall open.
Define Input File Name and Command
- For Command specify the solver executable .
- For Input File browse the parameterized file.
- Choice on handling number of concurrent jobs can be made suitably in this section.
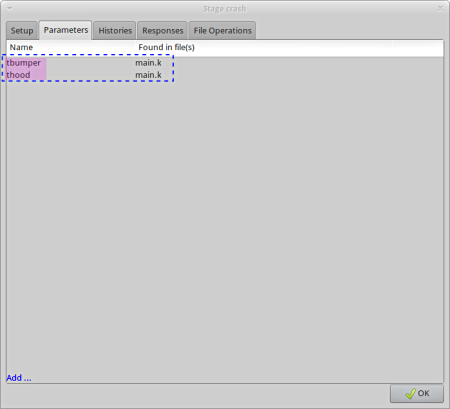
Design Parameters.
- The design parameters in the input files specified in the Setup can be viewed.
- For LS-DYNA, the input files are usually parameterized using *PARAMETER
- Otherwise the LS-OPT parameter format <<parameter_name>> may be used.
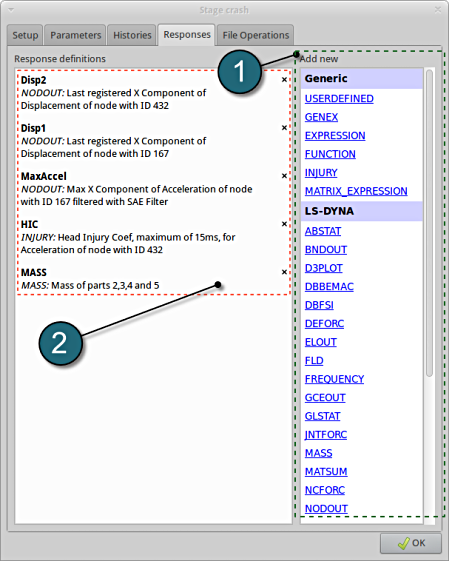
Now define the results to be extracted from the solver output database (to be used as objectives or constraints in the optimization phase) using the interfaces available in the Histories (curve data) or Responses (scalar values) tab, respectively.
Responses
- Select a response type from the several options available in Add new column located on the right side. A response can be a result of a mathematical operation applied to a time history curve or a previously defined response, or can be directly extracted using the standard LS-DYNA interfaces or a user-defined interface.
- Upon selection a seperate window appears where the user can define the reponse properties.
- The responses defined can be reviewed later for alterations if necessary.
Home Screen Process Flowchart
- Select the Setup box.
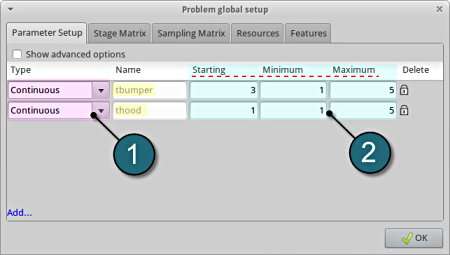
A window Problem global setup shall open.
Define the Parameters
Variables form the input file are automatically displayed.
- Select the Type of the desired variables. In most cases Continuous variables are used.
- Enter the requested values, i.e. Starting value, Minimum and Maximum values to define the design space for a continious variable..
Home Screen Process Flowchart
- Select the Sampling crash box.
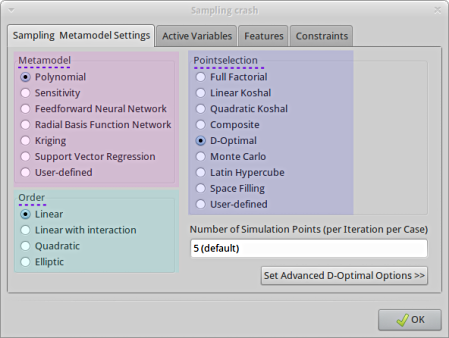
A window Sampling crash shall open.
Define Metamodel Settings
- Select the Metamodel, its Order and Point selection types, or just use the default values.
The Build Metamodels box is coupled to the same dialog as the Sampling box.
It is displayed at the end of the process to correctly represent the optimization process.
Home Screen Process Flowchart
- Select the Optimization box.
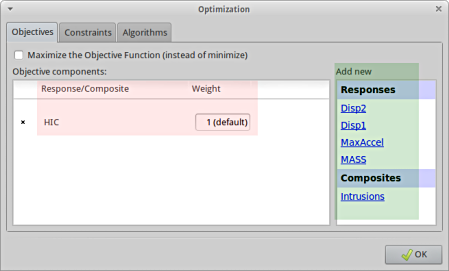
A window Optimization shall open.
Objectives
- Objectives are the functions to be minimized. From the previously defined Responses or Composites enlisted under the Add new section, the user has the choice to select a single or multiple objective.
- Make sure to select appropriate weights if multiple objectives are defined.
Constraints
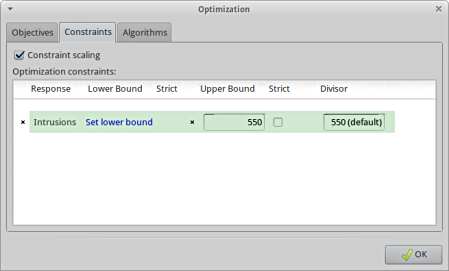
- Constraints are the functions to be satisfied. From the previously defined Responses and Composites, select the desired constraints and specify the lower and upper bounds, respectively.
- Use the default settings for the algorithm used for the optimization on the metamodel (Algorithms tab).
Home Screen Process Flowchart
-
Select the Termination criteria box.
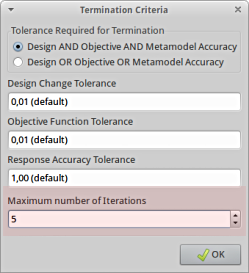
A window Termination criteria shall open.
- Change the Maximum number of Iterations to the desired value.
- Use the default values for the other features.
Run LS-Opt.
- Select the Run button from the Control Bar.
- It is recommended to first run Baseline Run to check if the stage process chain works correctly and the results are extracted as expected.
- Then select Normal Run to start the full task.
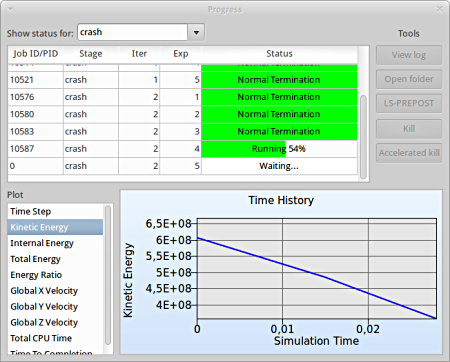
- During Run LS-OPT presents an option to view the Progress of the run sequence at every stage, by selecting the LED button adjacent to the Stage box in the GUI.
- Use the Viewer to evaluate the optimization results by selecting the icon
on the control bar of the main LS-OPT GUI window.
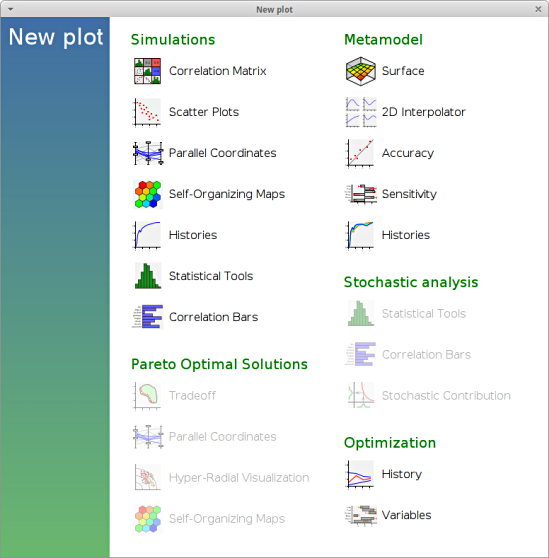
- The Viewer provides features to display metamodels, simulation results and the optimization progress, as well as sensitivities and statistics.
Metamodel Surface
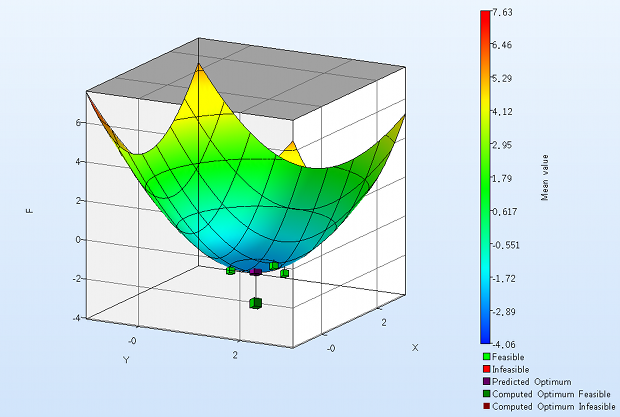
You can plot the metamodel surface you have built. The plot can be zoomed and rotated. You may also add the sampling points (both feasible and infeasible) and the optimum points (predicted and computed) to the plot. This is a visual way to check the results.
Sensitivity
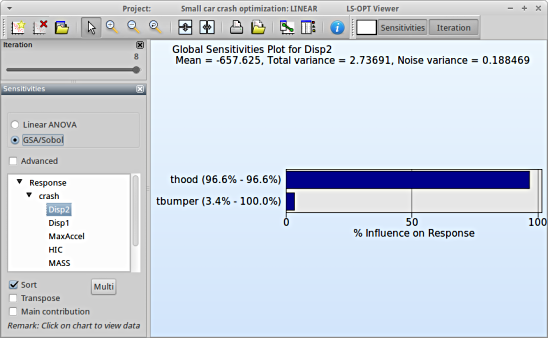
Which variable is the most important for a response? The sensitivity analysis shows the influence of all the variables on the selected response. There are two analysis methods to choose.
- Linear ANOVA (Analysis of Variance)
- GSA/Sobol (Sobol's Global Sensitivity Analysis)
Optimization History
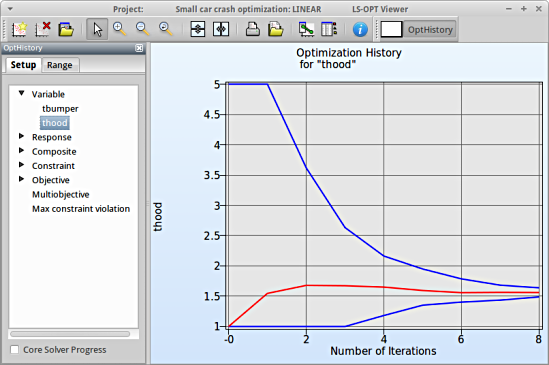
Progress of a variable, a response or other entities during the optimization process. If the strategy Sequential with Domain Reduction is applied, the blue curves show the shrink of the domain of a variable.

