Strategy Single Iteration vs. Sequential
Some applications of LS-OPT, like sensitivity analysis or multi-objective optimization (Pareto optimal solutions), require a global metamodel. There are two strategies available to calculate global metamodels, Single Iteration and Sequential. The strategies are compared by means of an application example.
The Crashworthiness Optimization example is used to compare the strategie Single Iteration and Sequential. The strategies and the number of simulation points are adapted.
- For Single Iteration the number of sampling points is set to 30.
- For Sequential 5 sampling points per iteration per case are calculated, and the maximal number of iterations is set to 6 iterations, hence 30 points are calculated in total.
Comparison of the results of the strategies Single Iteration and Sequential
Single Stage |
vs. |
Sequential
|
|||||||||||||||||||||||||||||||||||||||||
|
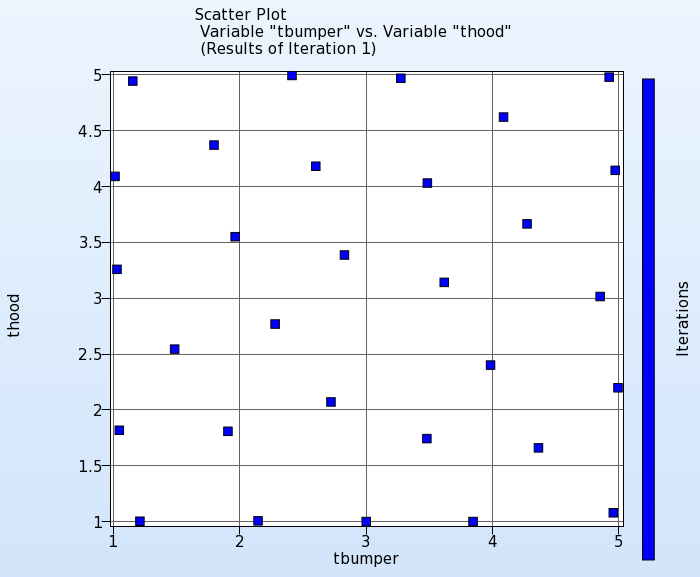
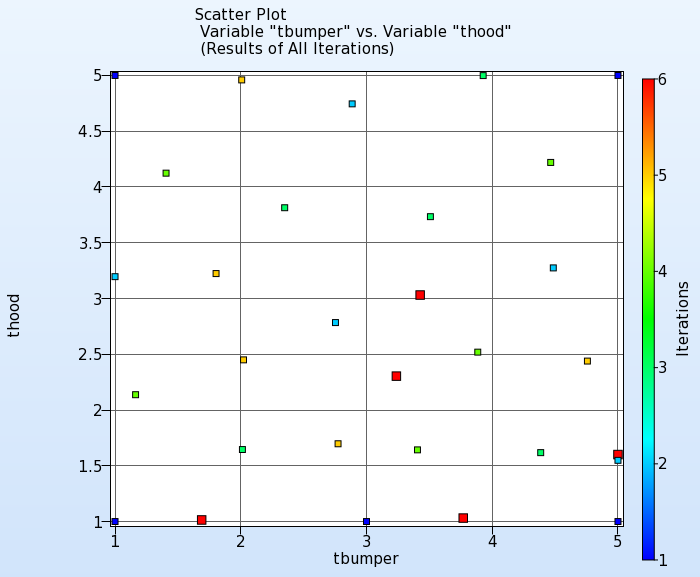
Scatter Plots in 2D for the design variables The distribution of the points is similar for both strategies. |
|||||||||||||||||||||||||||||||||||||||||||
|
|
 |
||||||||||||||||||||||||||||||||||||||||||
|
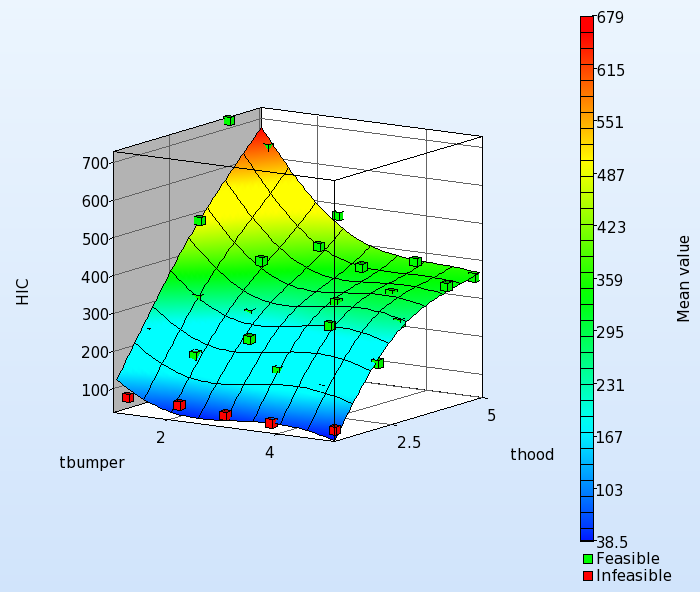
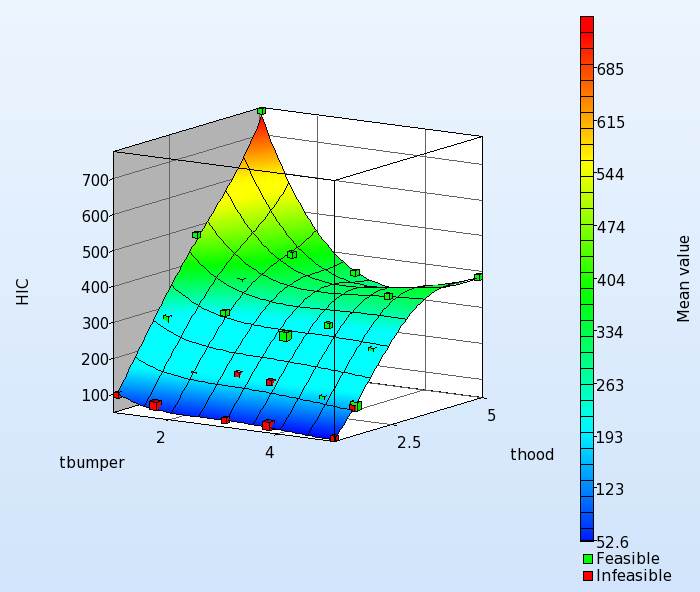
Metamodels Since the distribution of the points within the design space is a little bit different, the metamodels are also not exactly the same, but the tendencies are comparable. |
|||||||||||||||||||||||||||||||||||||||||||
 |
 |
||||||||||||||||||||||||||||||||||||||||||
|
Accuracies Also the accuracy of the metamodels is similar. For the responses HIC and Disp2, the strategy Sequential leads to a little better results, whereas for the responses Mass and Disp1, the Singel Iteration results are a little bit more accurate. |
|||||||||||||||||||||||||||||||||||||||||||
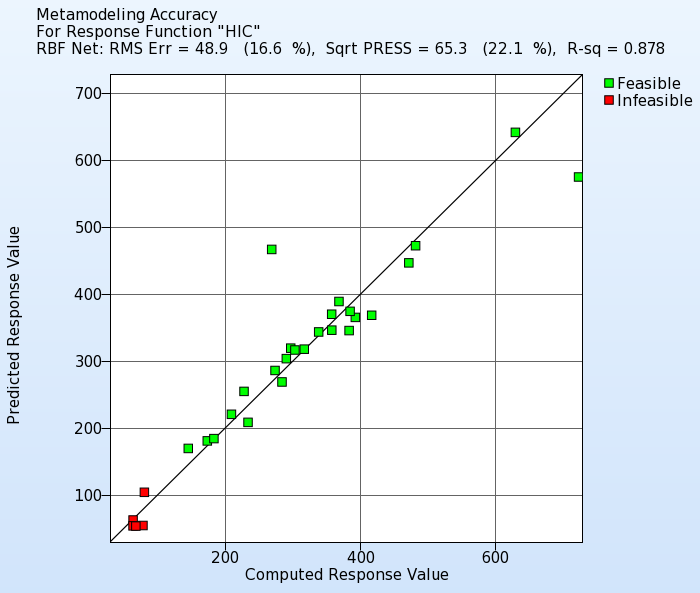 |
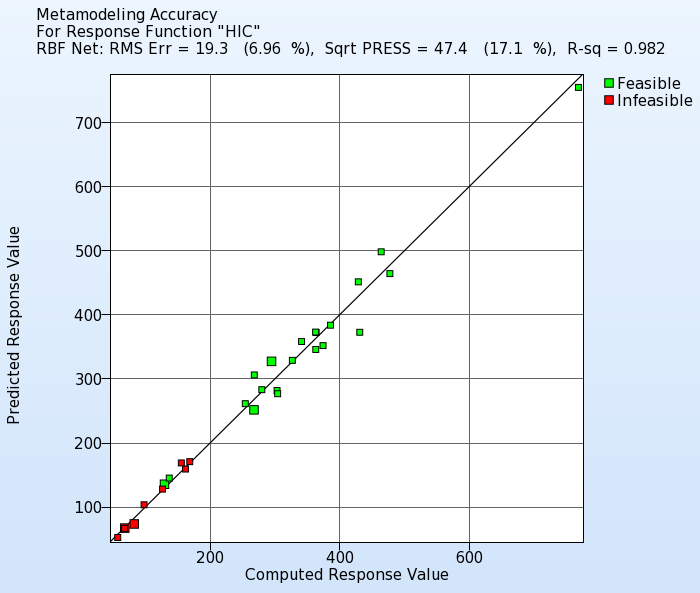 |
||||||||||||||||||||||||||||||||||||||||||
|
|||||||||||||||||||||||||||||||||||||||||||
|
Global Sensitivities The Global Sensitivity results are comparable and the variable ranking is the same for all responses. |
|||||||||||||||||||||||||||||||||||||||||||
 |
 |
||||||||||||||||||||||||||||||||||||||||||
|
|||||||||||||||||||||||||||||||||||||||||||
For the same total number of simulation points, the results of the strategies Single Iteration and Sequential are comparable.
Advantage of Sequential Strategy
The Sequential strategy is more flexible than the Single Iteration strategy. An advantage of Sequential methods is that one can set stopping tolerances. These allow the accuracy of the design model to be maximized if sufficient computing resources are available.
We can observe the progress of the metamodel quality, the sensitivity measures, ... after each iteration. In case there is no improvement, the process could be stopped, and continued otherwise.
|
SPRESS[%] errors of each response |
Iteration number | |||||
| 1 | 2 | 3 | 4 | 5 | 6 | |
| HIC | 91.5 | 39.5 | 28.8 | 20.9 | 17.7 | 17.1 |
| Mass | 5.63e-06 | 0.00769 | 0.00662 | 0.00682 | 0.00755 | 0.00774 |
| Disp2 | 2.62 | 1.45 | 0.443 | 0.507 | 0.435 | 0.373 |
| Disp1 | 4.19 | 2.14 | 2.22 | 2.39 | 2.37 | 2.24 |
If a Single Iteration strategy is selected, there is no information if additional simulation points could still improve the results, or even less points could have led to a similar accuracy.

