Multi-objective optimization (MOO)
In the mathematical sense multi- objective problems therefore have multiple solutions, typically defining a line or a surface in the space defined by the objectives (i.e. two-dimensional space for two objectives, etc.). In design optimization terminology such a solution is referred to as a Pareto Optimal Frontier (POF), or trade-off curve or surface.
The POF curve can then be used by designers to choose a unique design which satisfies the needs of all the disciplines, although it is likely to be a compromise solution.
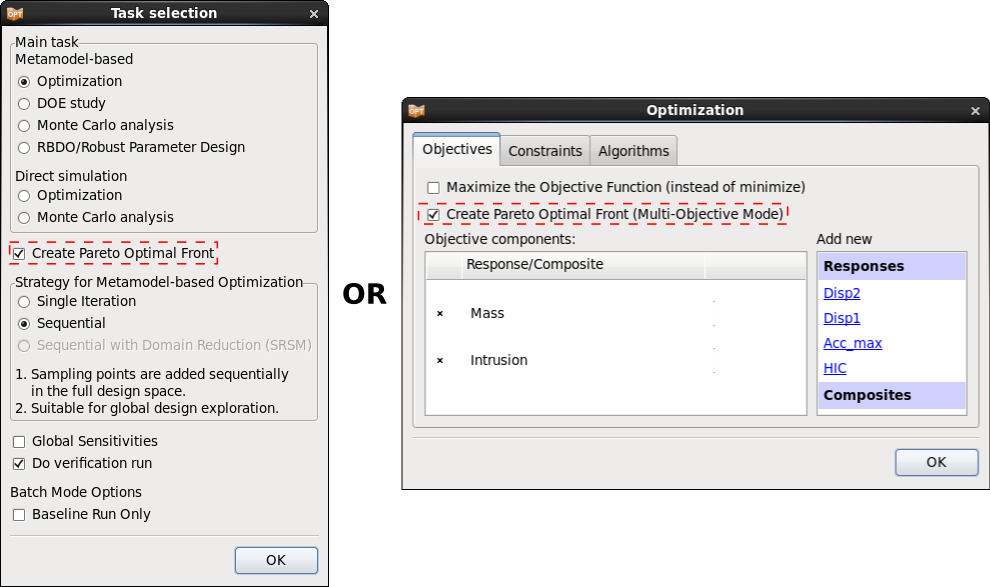
To activate the POF feature, the option Create Pareto Optimal Front can be selected in the Task or Optimization dialog. The option is only available if at least two objectives are defined.

The recommended optimization task and strategy for MOO is Metamodel-based Optimization using the Single Iteration or Sequential strategies. But a direct Genetic Algorithm is also available.
Direct Genetic Algorithm
To calculate Pareto optimal solutions using the Direct Genetic Algorithm, select Direct simulation Optimization as main task.
The advantage of using a direct task is, that is uses only simulation results to find the optimal value, hence there is no approximation error. The disadvantage is that the number of simulation runs needed to find an optimal value can be high. Therefore this task can only be used for small models or if sufficient computational resources are available.
Metamodel-based Genetic Algorithm
To calculate Pareto optimal solutions using a metamodel-based Genetic Algorithm, a global approximation is recommended. Select Metamodel-based Optimization as the main task, and use the strategy Single iteration or Sequential together with a nonlinear metamodel, e.g. Radial Basis Functions or FeedForward Neural Nets.
Because Pareto solutions are often global in nature (spans a significant part of the design space), global metamodel accuracy is typically required. This may be difficult to achieve with a large number of design variables. In this case the Direct GA (which will also be expensive) is the only remaining option.
Viewer
Various plot types that are available for the visualization of Pareto optimal solutions can be used to explore those solutions and select the appropriate optimal solution that fits best to the application. An example of multi-objective optimization can also be observed for more information.
Trade-off
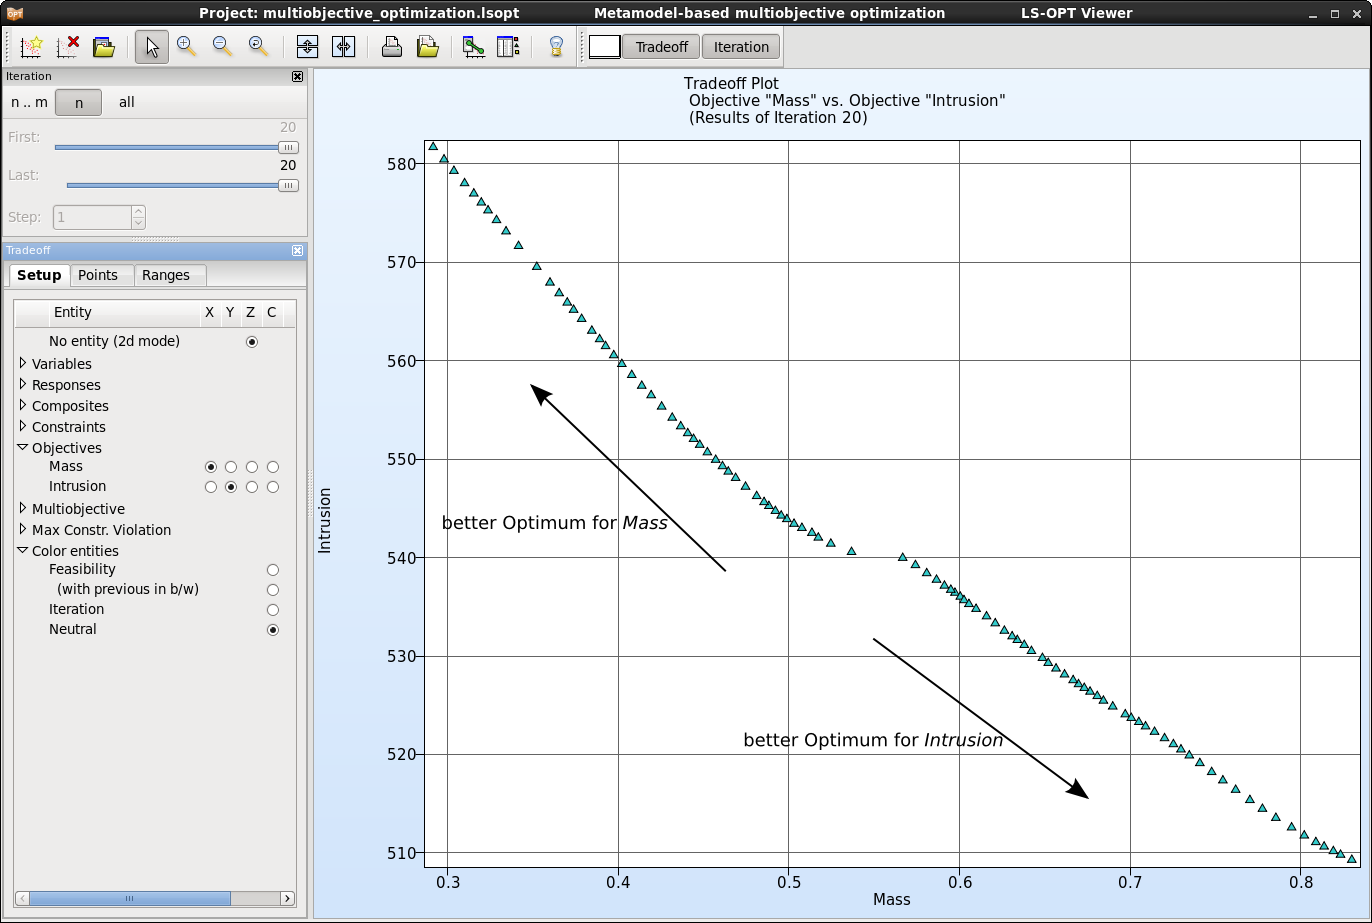
The Tradeoff plot functions similar to the Scatter plot, but the default setting is here to plot Pareto optimal solution data instead of Analysis Result data. This plot is restricted to 4 dimensions to be displayed on the 3 axis and uing the color of the points.

Parallel Coordinates
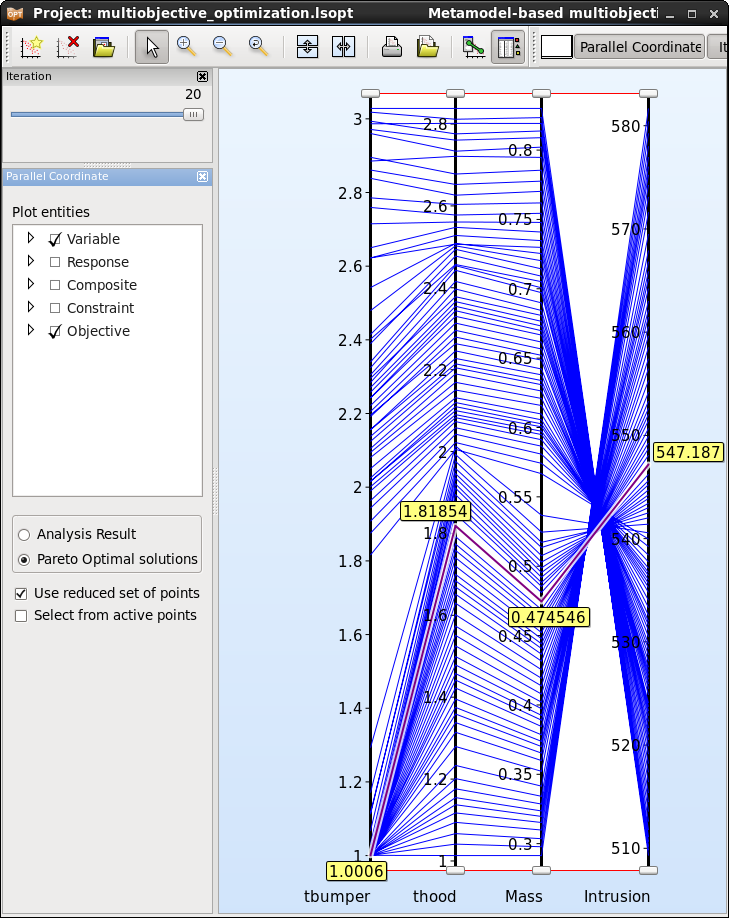
The number of dimensions that can be visualized using the Parallel Coordinate Plot is not restricted. Each dimension is visualized on a vertical axis and each data point is shown as a poly-line connecting the respective values on the vertical axis.

Self Organizing Maps
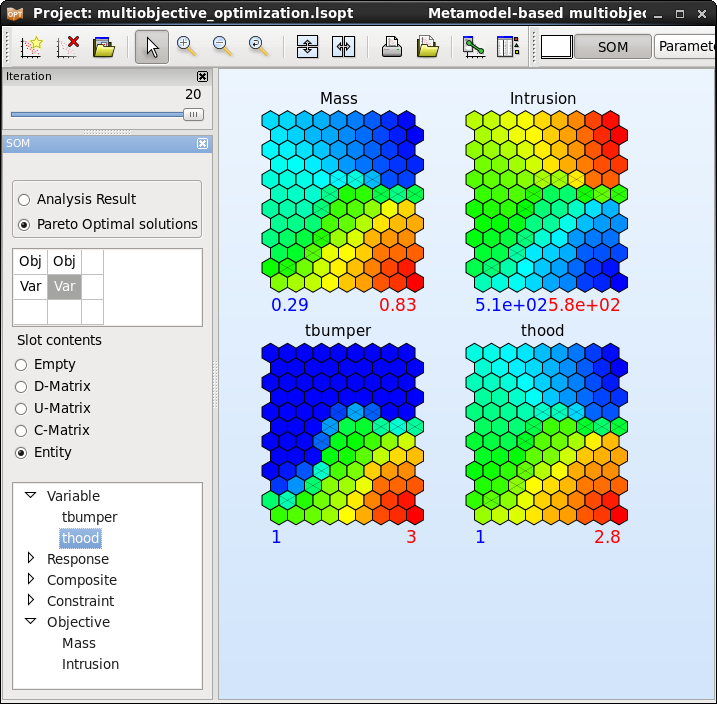
Visualization using Self Organizing Maps is a convenient tool to determine conflicting objectives and objectives that are in agreement.

