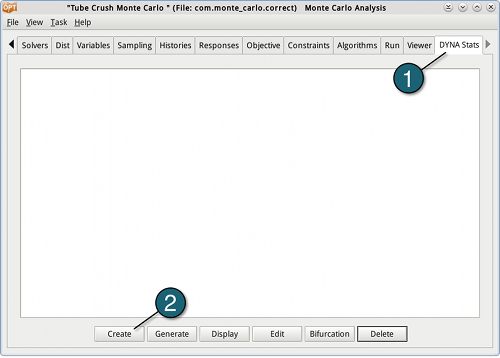
Display the Statistics in LS-PrePost (History)- Select the DYNA Stats panel.
- Click on Create button.
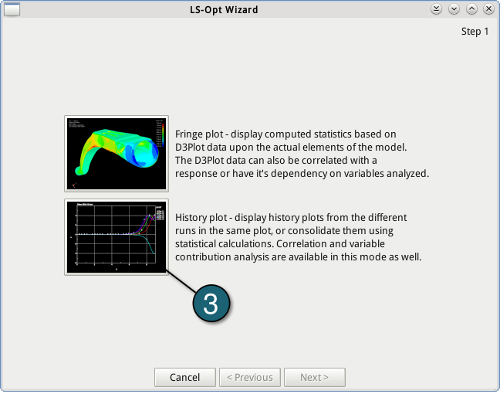
- Select History plot for the type of plot.
| 
|
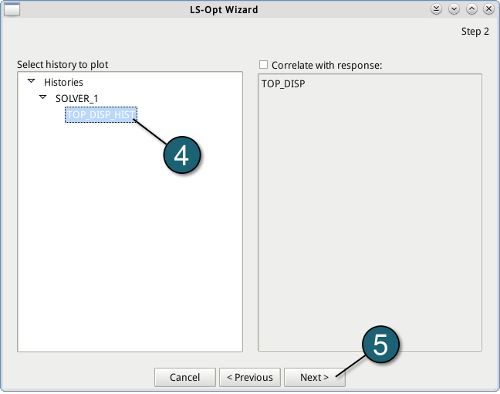
- Select TOP_DISP_HIST from the list.
- Go to the next panel.
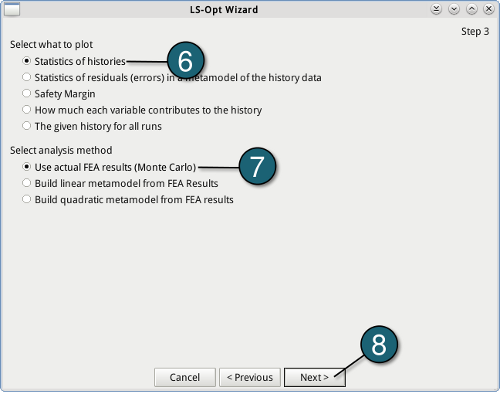
- For what to plot select Statistic of histories.
- For analysis methed, choose Use actual FEA results.
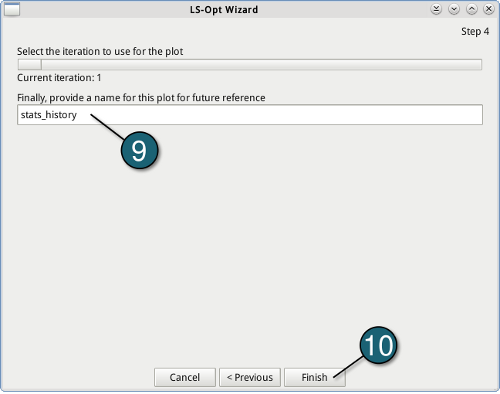
- Go to the next panel.
- Give a name to this plot, e.g. state_history.
- Push the Finish button.
| 
|
Statistics of the LS-OPT History→ The figure shows the statistics of the TOP_DISP_HIST history (z-displacement at node 486). | 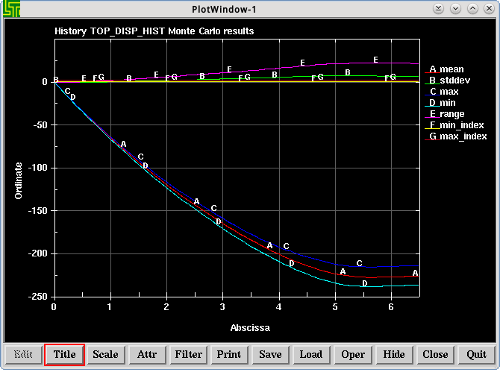 |
Display the Statistics in LS-PrePost (History)- It follows the way above, except:
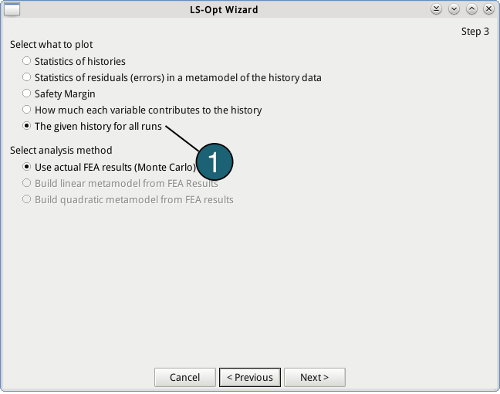
- By the second step, choose The given history for all runs for what to plot.
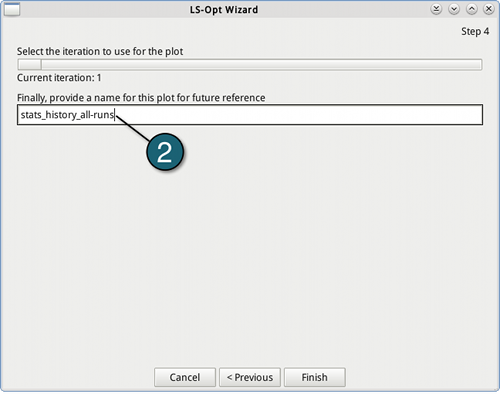
- By the last step, give a name to this plot, e.g. stats_hisory_all-runs.
| 
|
Statistics of the LS-OPT History→ LS-OPT history TOP_DISP_HIST (z-displacement at node 486) of all the LS-DYNA runs can be viewed simultaneously. | 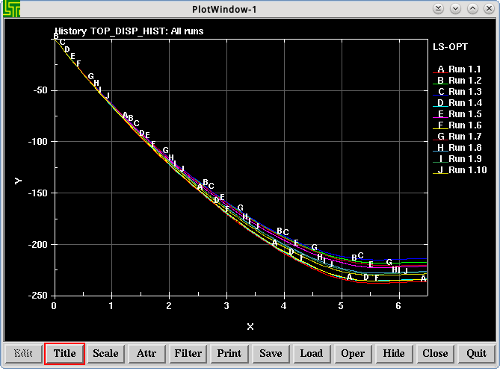 |