Scatter Plots
Scatter Plots
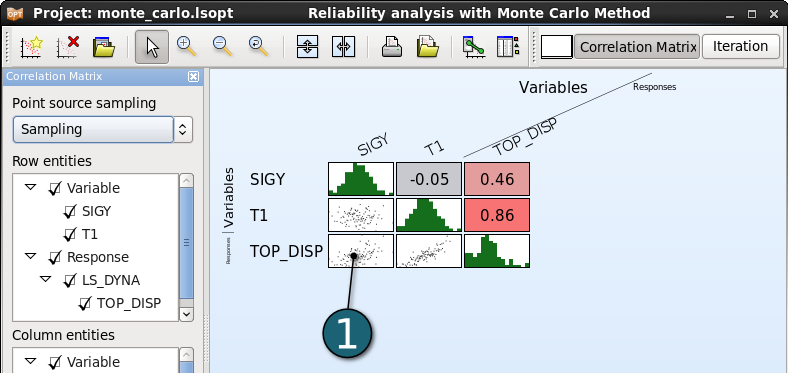
- As explained in the previous step, the correlation matrix displays 2D scatter plots. Double clicking on a scatter plot in the correlation matrix will open the Scatter Plot for the chosen variables.
- A Scatter Plot can be also opened either by clicking on the New Plot icon in the menu bar or by clicking on the Open the viewer icon on the Home Screen Process Flowchart.

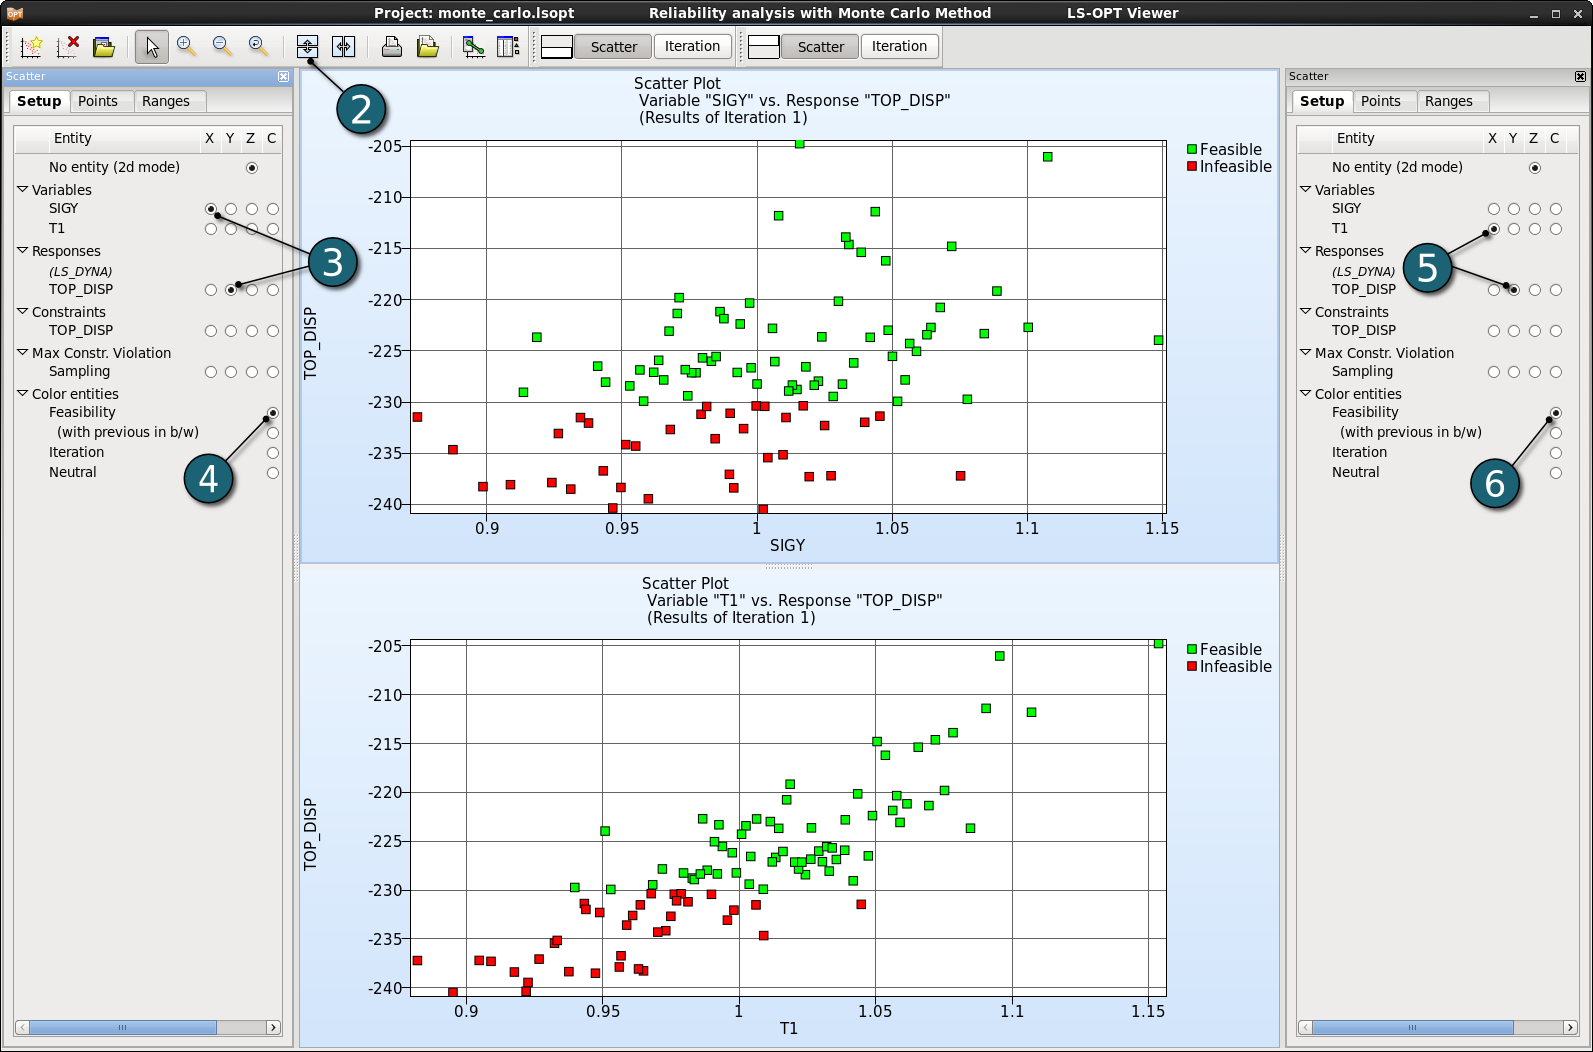
- Click on the Split vertical icon in the menu bar to have two scatter plots for both variables vs. the response.
- Select the variable SIGY and the response TOP_DISP for x- and y-axis, respectively.
- Show the Feasibility of the simulation points using the color selection.
- Select the variable T1 and the response TOP_DISP for x- and y-axis for the second scatter plot, respectively.
- Show the Feasibility of the simulation points.
The linear correlation values can be confirmed using the Scatter Plots for this example.

