Self-Organizing Maps
Visualization using Self Organizing Maps is a convenient tool to determine conflicting objectives and discontinuities in the Pareto optimal front.
New Plot - Self Organizing Maps
- Click on the New Plot icon in the menu bar - (or click on the Open the viewer icon on the Home Screen Process Flowchart).
A New Plot window shall open.
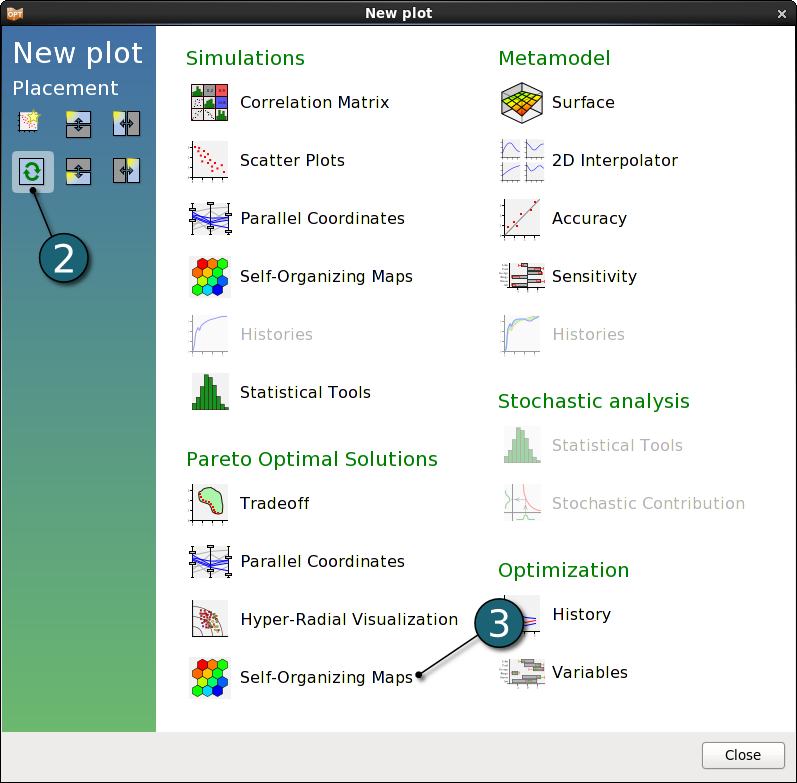
- Select Replace current plot icon.
- Select Self-Organizing Maps under Pareto Optimal Solutions.


Self-Organizing Maps Settings
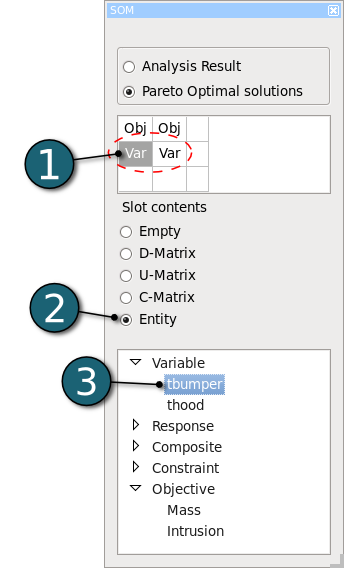
- Select the cell under the first objective. i.e the cell 2x1.
- Select Entity.
- Select the Entity as the variable tbumper.
- Repeat the steps 4-5 for the cell 2x2 and for the variable thood.

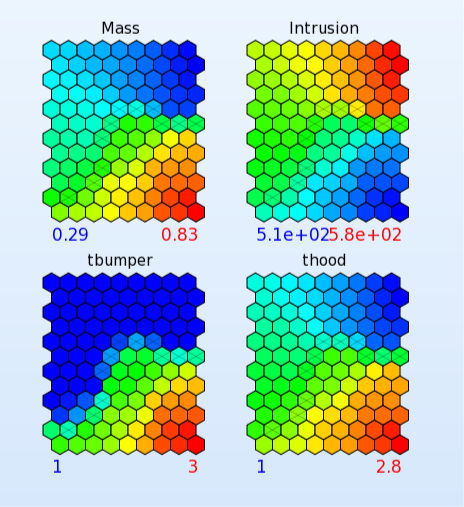
- Visualization using Self Organizing Map is a convenient tool to determine conflicting objectives and and objecitves that are in agreemnt, and also the relation between variables and objectives or constraints, respectively.

