Solution with LS-OPT
Working Directory and Extraction of necessary files
- Create a working directory in the desired location to keep the LS-OPT project file and input files, as well as the LS-OPT program output, e.g. full_vehicle_model.
- Extract all the files required for this example from download section into the working directory.
Project Details
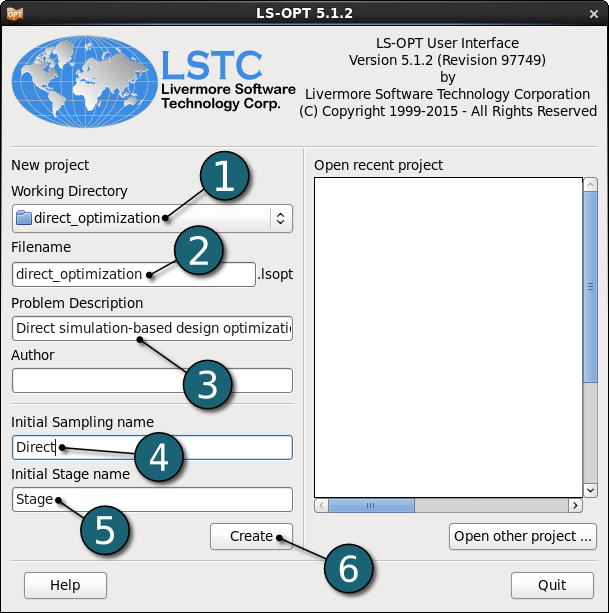
- Select the Working Directory of the LS-OPT project.
- Select a suitable name for the file under Filename (e.g. direct_optimization). The extension .lsopt is appended by LS-OPT.
- Description of the main task can e.g. be a suitable name for Problem Description ( in this case, Direct simulation-based design optimization, optional) .
- Choose a suitable name under the Initial Sampling name (e.g. Direct).
- Choose a suitable name under the Initial Stage name (e.g. Stage).
- Click on the Create button to initiate the formation of the input file.
- The main GUI window of LS-OPT opens.
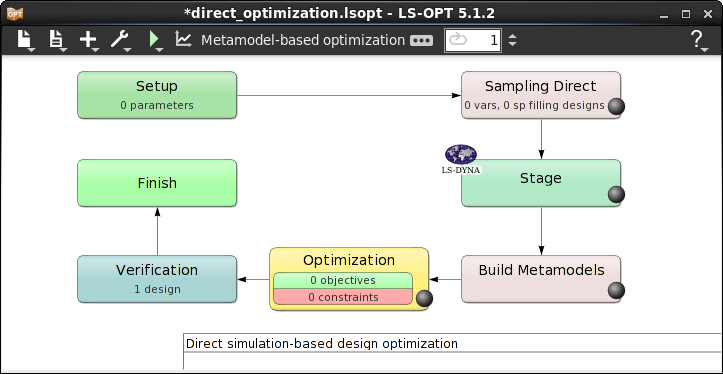
Home Screen Process Flowchart
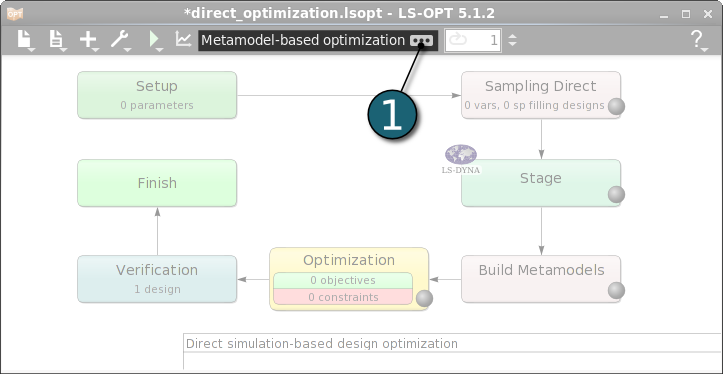
- Click on the Show task settings icon to select the optimization task and strategy.
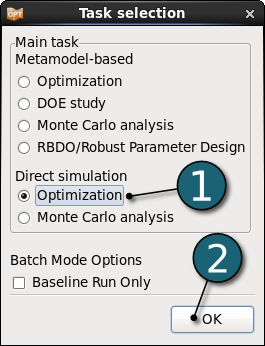
The Task Selection window shall then open.
Define the Main Task
- Select the Direct simulation option as Optimization. The Genetic Algorithm will be used to solve the optimization problem.
- Click on the OK button to proceed.
Home Screen Process Flowchart
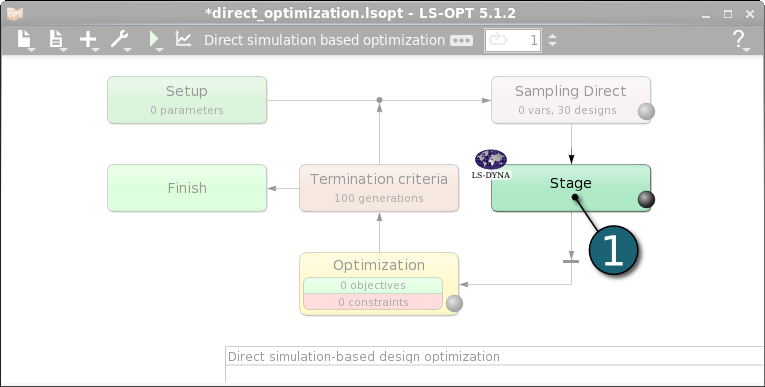
- Double click on the Stage box to define the solver step in the simulation process.
The Stage dialog window shall open.
Define Stage Setup
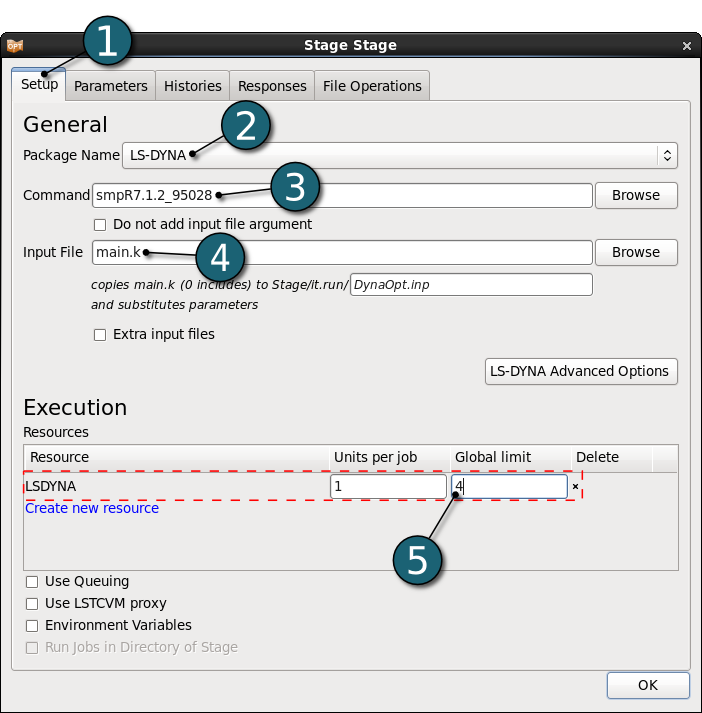
- Select the Setup tab.
- Select the Package Name LS-DYNA.
- For Command enter smpR7.1.2_95028 (This command name can be different on your computer). On Windows, the command has to be specified using the absolute path.
- For Input File browse the LS-DYNA keyword file main.k. Parameters are defined in this file using *PARAMETER keyword.
- For efficient usage of the computing power from the machine, choice on handling number of concurrent jobs can be made suitable in this section. For more details see FAQ resources.
- The design parameters defined in the input file can be displayed by selecting the Parameters tab in the Stage dialog.
Define Responses
Here we define the system responses needed to define the optimization problem described in the Problem Description.
Define the displacement of the node 432
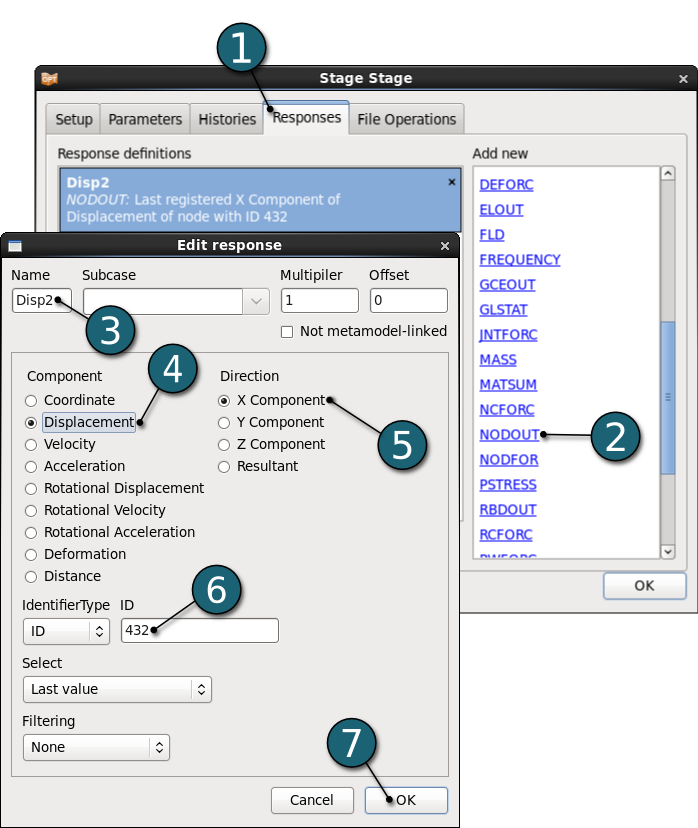
- Select the Responses tab in the stage dialog.
- Select the type of the response as the LS-DYNA binout interface NODOUT from the Add new list on the right side. Edit response dialog will open.
- Enter the Name of the response as Disp2.
- For the Component select Displacement from the list.
- For the Direction select X Component from the list.
- For the node ID enter 432.
- Click on the OK button to end the definition of the response Disp2.
Define the displacement of the node 167
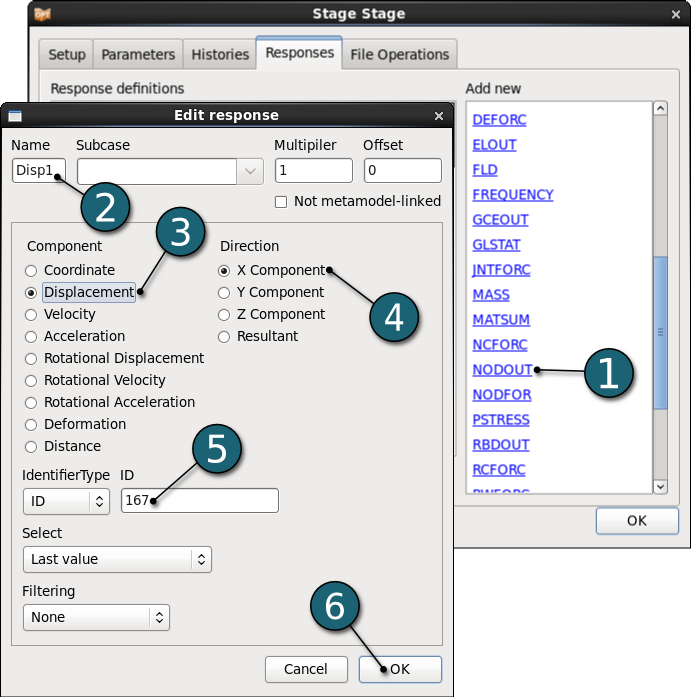
- Select the type of the response as the LS-DYNA binout interface NODOUT from the Add new list. Edit response dialog will open.
- Enter the Name of the response as Disp1.
- For the Component select Displacement from the list.
- For the Direction select X Component from the list.
- For the node ID enter 167.
- Click on the OK button to end the definition of the response Disp1.
Define the maximum acceleration of node 167
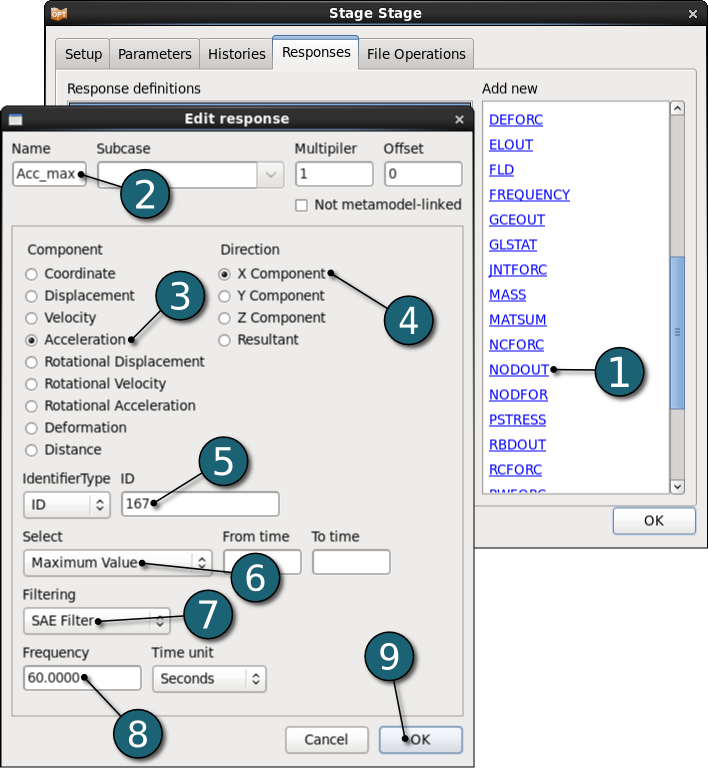
- Select the type of the response as the LS-DYNA binout interface NODOUT from the Add new list. Edit response dialog will open.
- Enter the Name of the response as Acc_max.
- For the Component select the Accelaration.
- For the Direction select X Component.
- For the node ID enter 167.
- Select the Maximum Value of the acceleration of this node.
- Set the Filtering as SAE Filter.
- Enter the Frequency as 60.0000 Seconds.
- Click on the OK button to end the definition of the response Acc_Max.
Define Mass
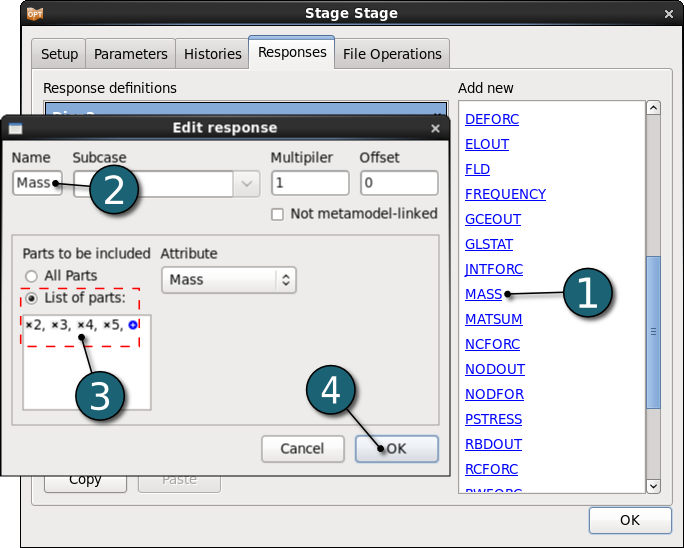
- Select the type of the response as the LS-DYNA D3hsp interface MASS from the Add new list. Edit response dialog will open.
- Enter the Name as Mass.
- Enter the the List of Parts as 2, 3, 4 and 5.
- Click on the OK button to end the definition of the response Mass.
Define HIC
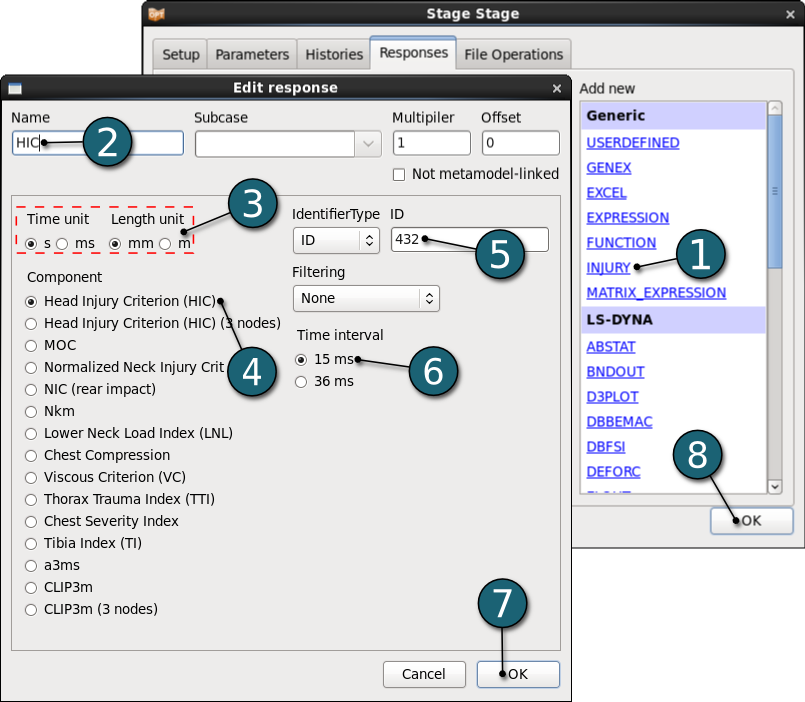
- Select the type of the response as INJURY from the Add new list. Edit response dialog will open.
- Enter the Name as HIC.
- Set the Time unit to s and Length unit to mm.
- For the Component select the Head Injury Criterion (HIC).
- For the node ID enter 432.
- Select the Time interval as 15 ms.
- Click on the OK button to end the definition of the response HIC.
- Click on the OK button to proceed.
Home Screen Process Flowchart
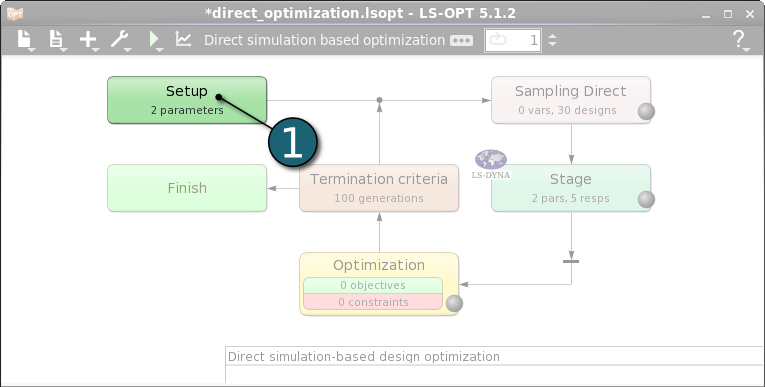
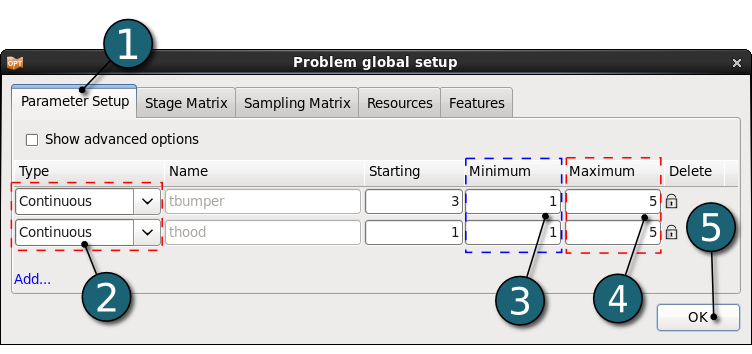
- Double click on the Setup box to define the parameter types and the design space.
The Problem global setup dialog shall open.
Define Parameters
- Select the Parameter Setup tab.
- Select the variable Type of the two parameters tbumper and thood as Continuous.
- Set the Minimum values of the both parameters to 1.
- Set the Maximum values of the both parameters to 5.
- Click on the OK button to proceed.
Home Screen Process Flowchart
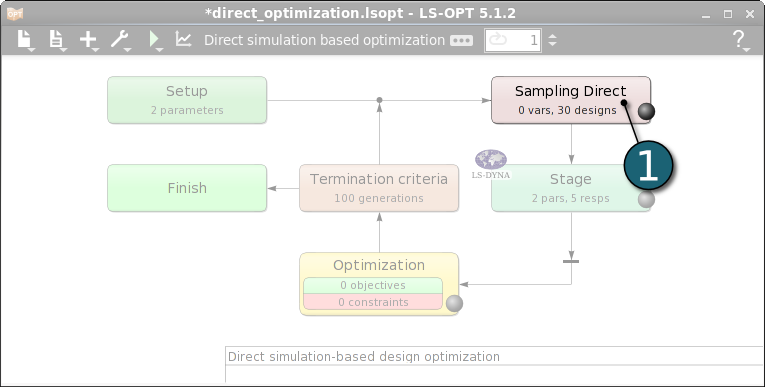
- Double click on the Sampling Direct box in order to define sampling settings.
A Sampling dialog shall open.
Define Sampling Settings
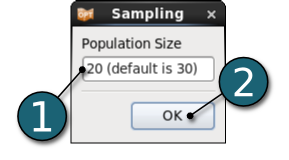
Since we use a direct optimization approach, we only need to define the population size for the genetic algorithm.
- Enter 20 for the Population Size.
- Click on the OK button to proceed.
Home Screen Process Flowchart
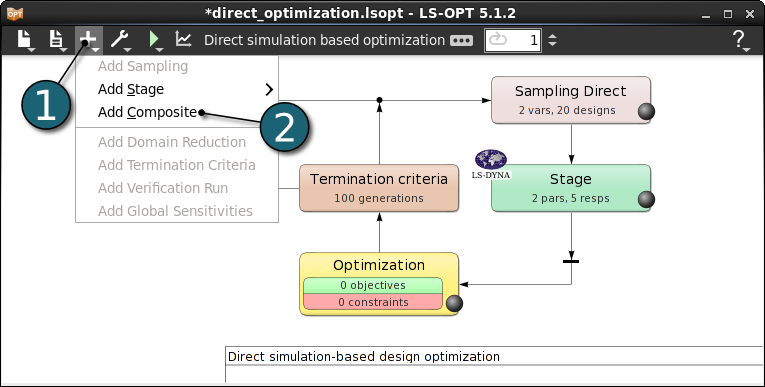
Add Composite
- Click on the Add menu in the control bar.
- Select Add Composite from the Add list.
A Composites dialog shall open.
Define Composites
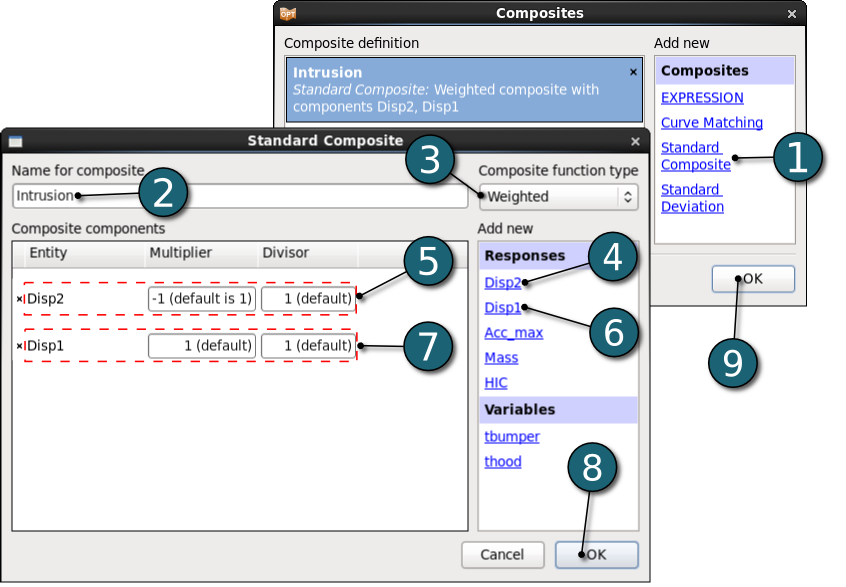
- Select the type of composite as Standard Composite in the Composites list to define
Intrusion = Disp1 - Disp2. - Enter the Name as Intrusion.
- Select Composite function type as Weighted.
- Select the response Disp2.
- Set the Multiplier to -1 and the Divisor as default 1 for Disp2.
- Select the response Disp1.
- Set the Multiplier to -1 and the Divisor as default 1 for Disp1.
- Click on the OK button to end the definition of the composite.
- Click on the OK button to proceed.
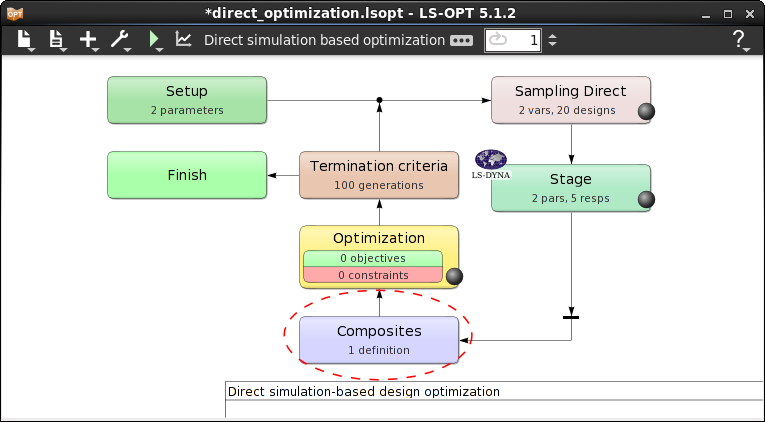
- After defining composite expression the Composite box takes its place in the Home Screen Process Flowchart.
Home Screen Process Flowchart
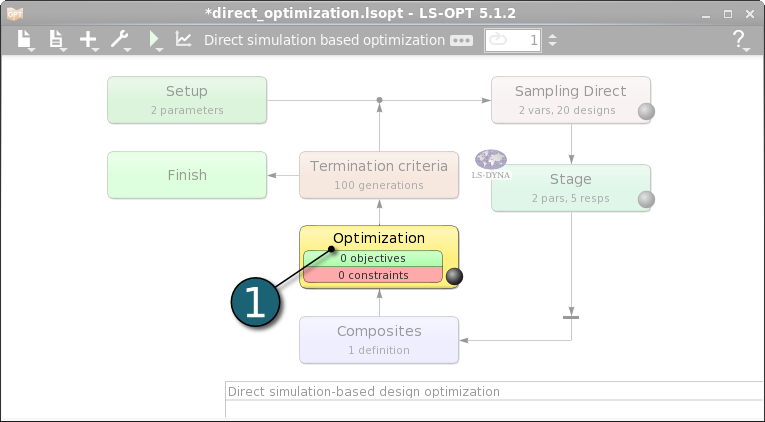
- Double click on the Optimization box to specify objectives and constraints for the design formulation and the optimization algorithm.
The Optimization dialog shall open.
Define Objective
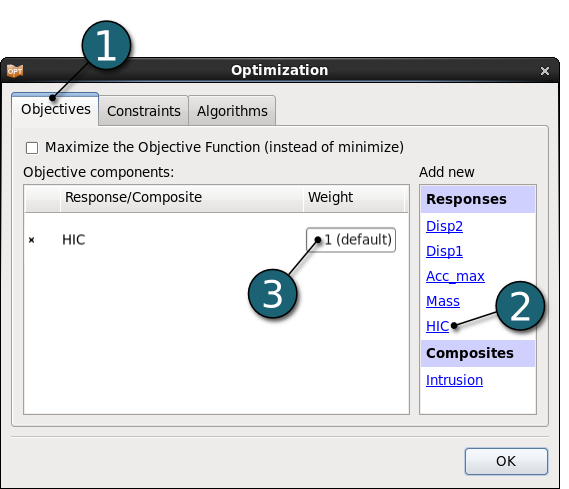
- Select the Objectives tab.
- From Responses list select HIC as the objective.
- Use the default Weight 1. If you have multiple objectives, you may assign different weights to each one according to their importance.
Define Constraints
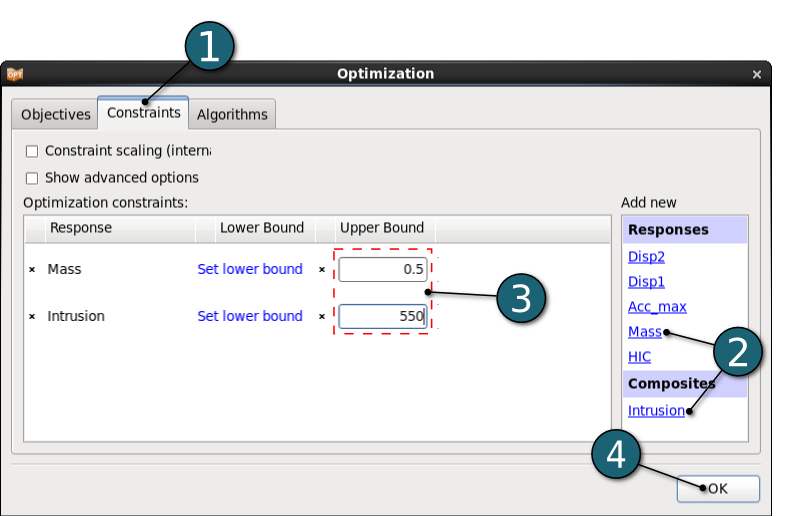
- Select the Constraints tab.
- Select Mass from the Responses list and Intrusion from the Composites list as the optimization constraints.
- Set the Upper Bound for Mass to 0.5 and for Intrusion to 550.
- Click on the OK button to proceed.
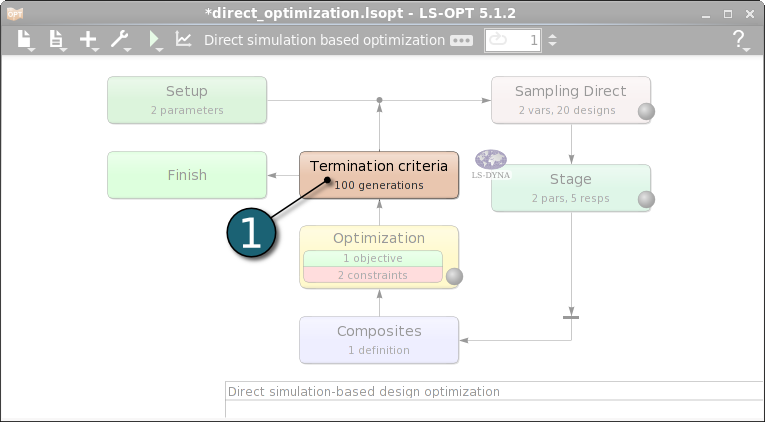
Depending on the optimization task, the user can specify appropriate termination criteria.
Home Screen Process Flowchart
- Double click on the Termination criteria box.
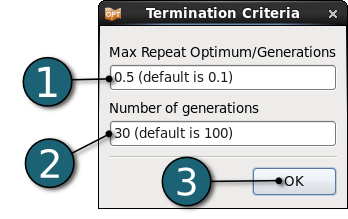
A Termination Criteria dialog will open.
Define Termination Criteria
- Enter 0.5 for the Max Repeat Optimum/Generations.
- Enter 30 for the Number of generations.
- Click on the OK button to proceed.
The optimizaiton will stop if 15 = 0.5*30 times the same point is found as optimum.
Home Screen Process Flowchart
Run LS-OPT
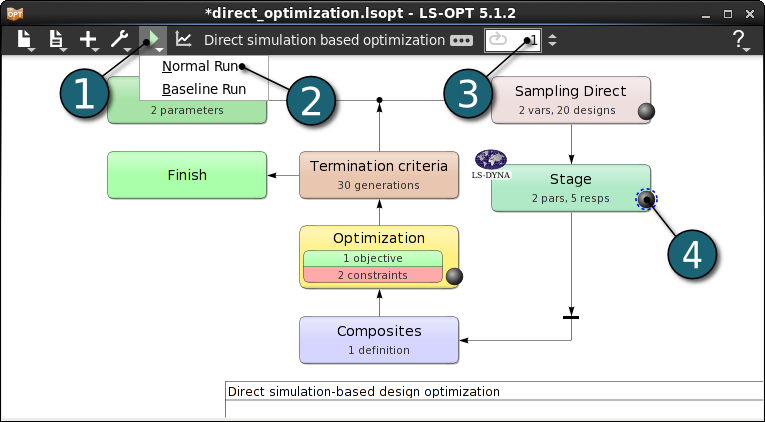
- Click on the Run button on the Control Bar.
- Click on the Normal Run.
- The user can get information on the status of the current iteration during execution.
- For every stage the user has the option to observe the progress of the program execution by selecting the LED at the corner on the Stage box. It is possible to observe the Progress and View Log for more information about the execution process.
Home Screen Process Flowchart
- Click on the Open the viewer icon in the control bar on the Home Screen Process Flowchart.
A New Plot window shall open.
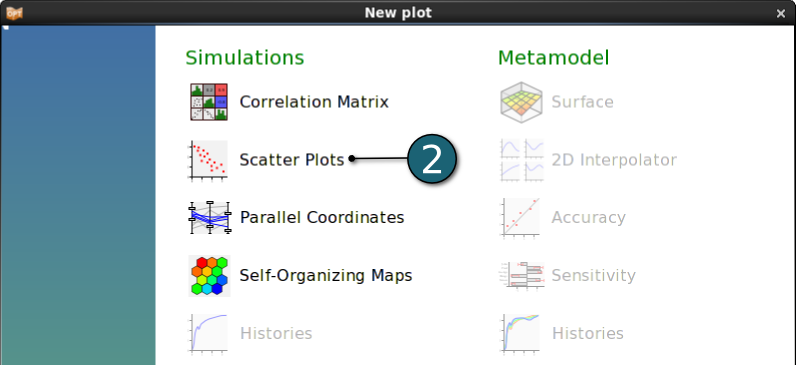
- Select Scatter Plot under Simulations.

Scatter Plot Settings
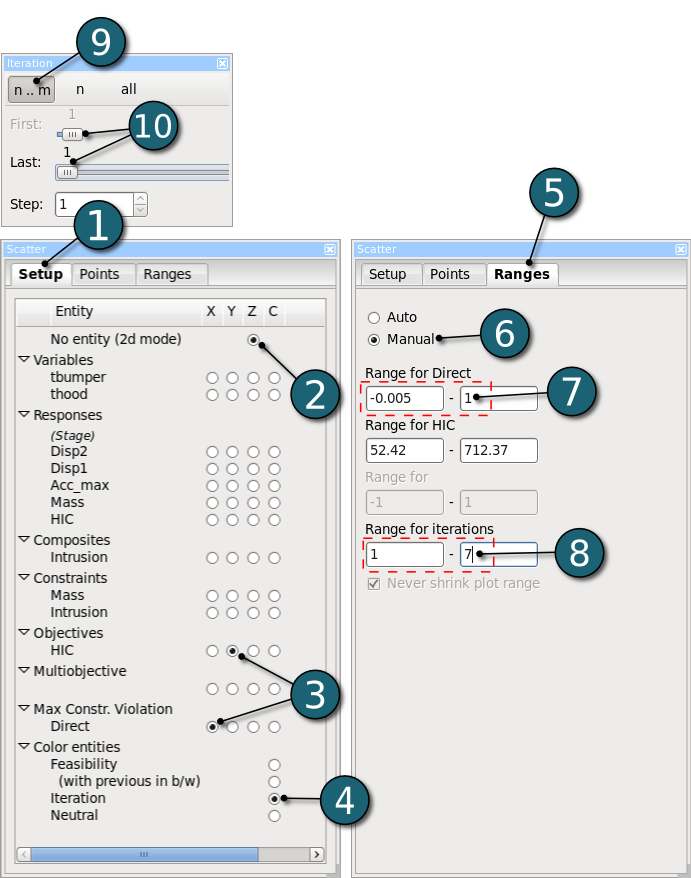
- Select the Setup tab in Scatter settings dialog.
- Select No entity for the z-axis to obtain 2D plot.
- Select the x and y axis as Max. Constraint Violation Direct and the objective HIC, respectively.
- Select the Color entity option as Iteration to display the iteration sequence using a color progression from blue through red.
- Select the Ranges tab in Scatter settings dialog.
- Select Manual to set the plot axes ranges manually.
- Set the Range for Direct between -0.005 and 1 to observe the behavior of optimization results clearly.
- Set the Range for iterations between 1 and 7.
- Select n .. m in the Iteration settings dialog to display the iteration range and step size.
- With the help of the slider we can set the iteration range with the first and last iteration numbers.
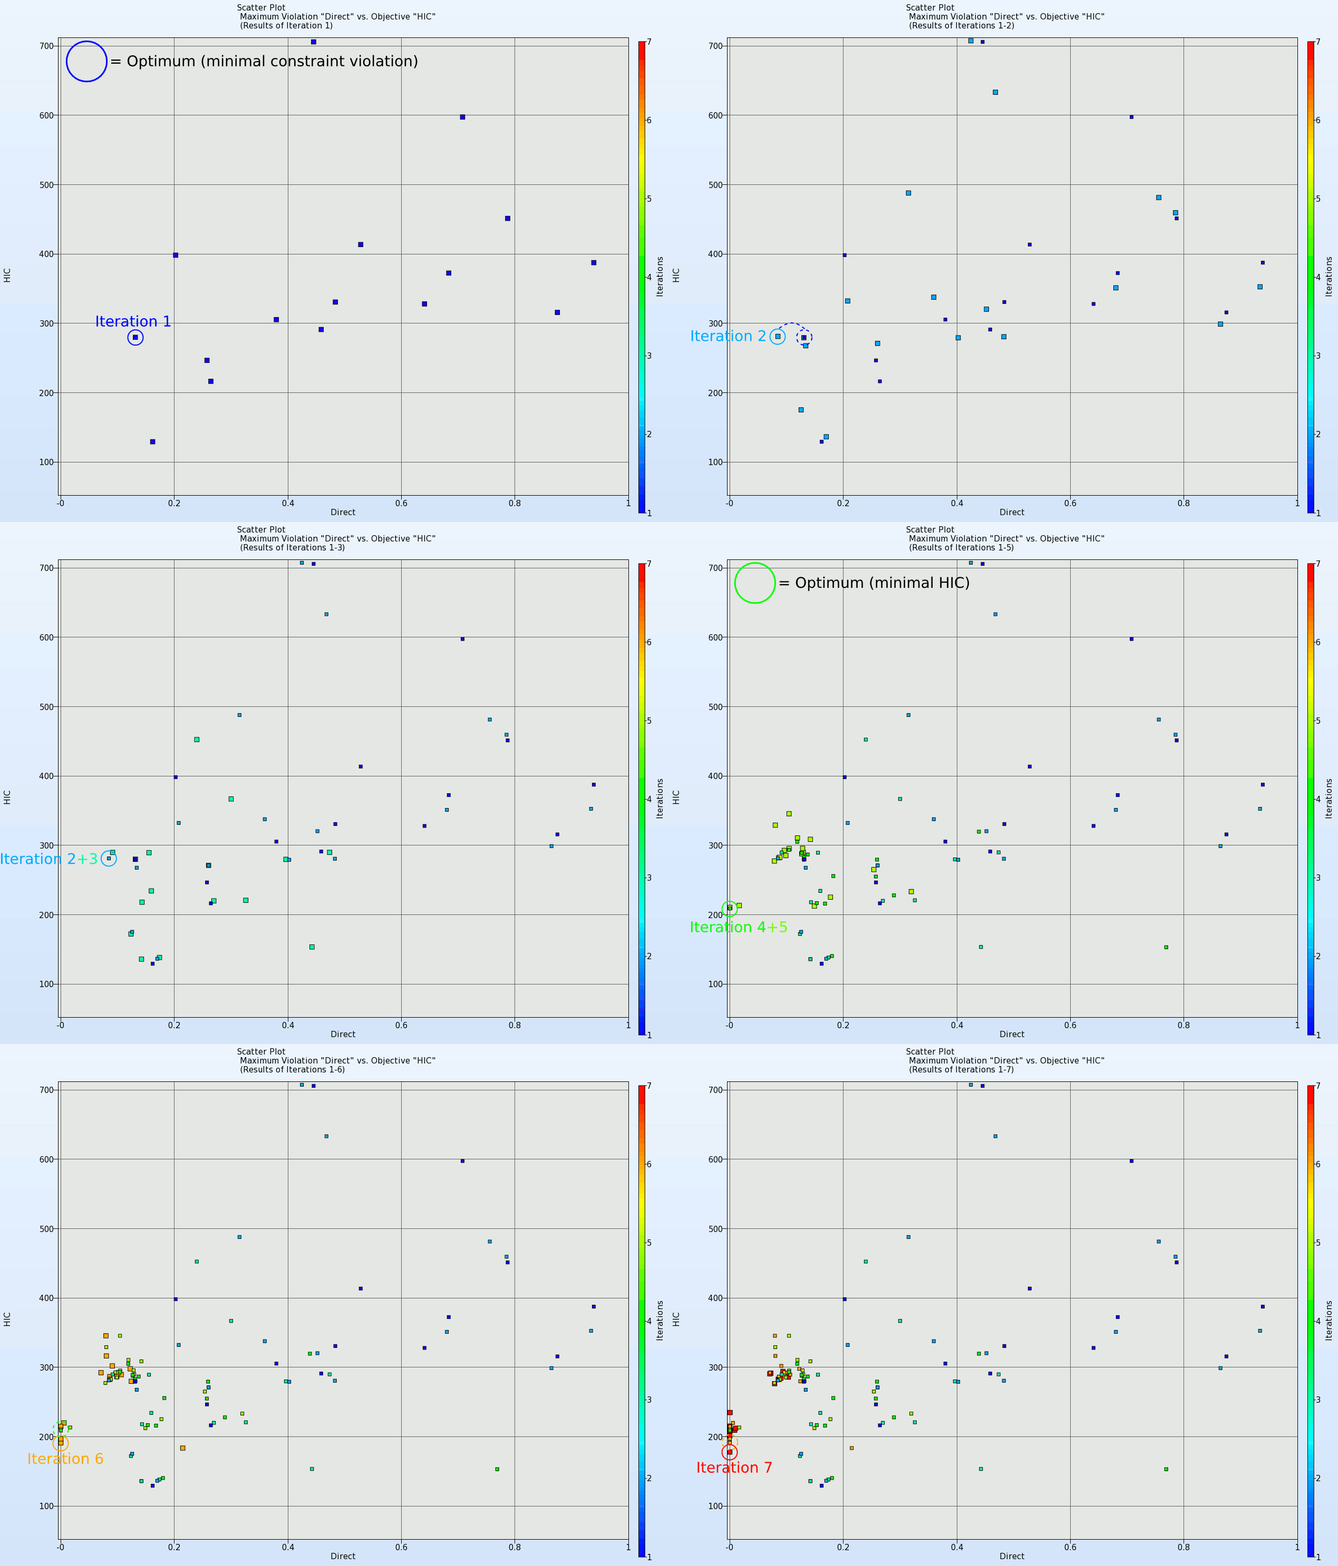
- In the scatter plot below we can observe the development of the optimum design according to minimal constraint violation and then minimal objective for the first seven iterations.
- The first objective of the genetic algorithm is to have no constraint violation. According to that after finding the optimum, which has no constraint violation, the minimal objective value of the problem will then be searched. In this example we can observe this main idea of the genetic algorithm, e.g. until the fourth iteration the solution having minimal constraint violation is selected as optimum. After finding the optimum having zero constraint violation the objective of the problem which is minimal HIC value is optimized with the following iterations.
- In direct optimization algorithm it is also possible to have a better optimum solution after having repeatedly found optima, e.g. after iterations 2 and 3 or 4 and 5 there are better optimums found.
New Plot - Optimization History
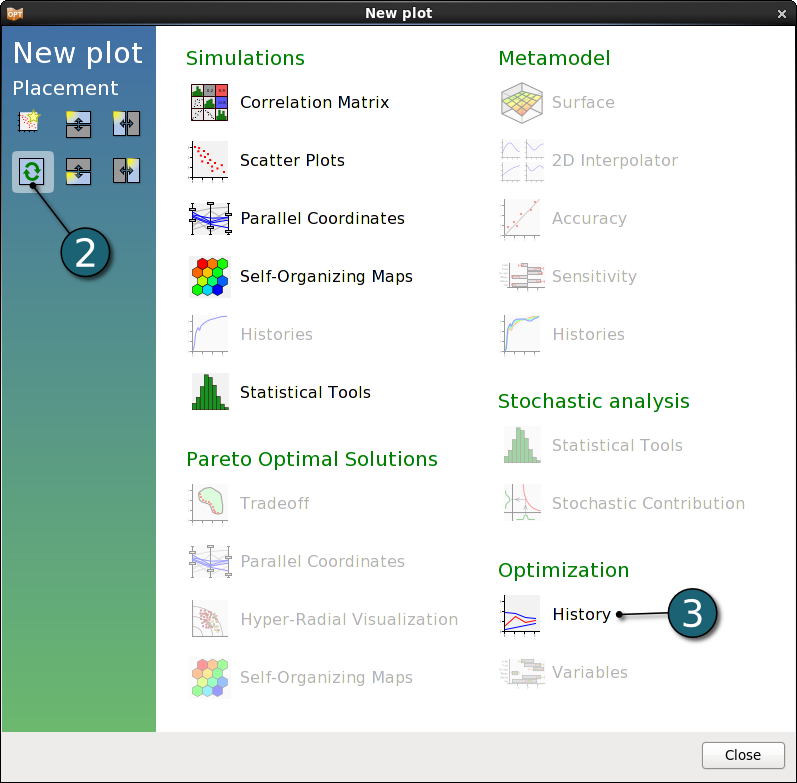
- Click on the New Plot icon in the menu bar - (or click on the Open the viewer icon on the Home Screen Process Flowchart).
A New Plot window shall open.
- Select Replace current plot icon.
- Select History under Optimization.

Optimization History - Design Variables
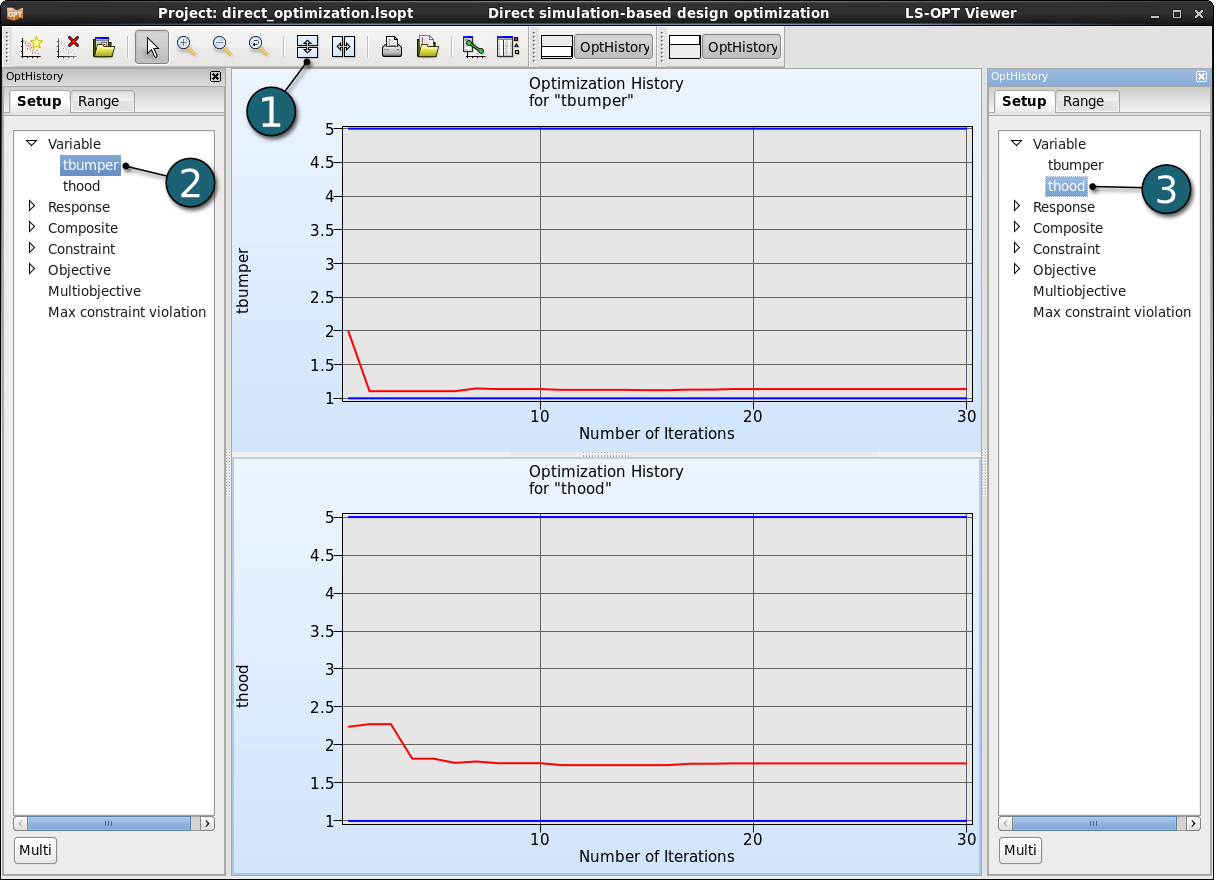
- Click on the Split vertical button to display two optimization histories together, i.e. the history of the design variables tbumper and thood.
- Select tbumper in the Setup dialog of the first plot.
- Select thood in the Setup dialog of the second plot.
Optimization History - Constraints & Objective
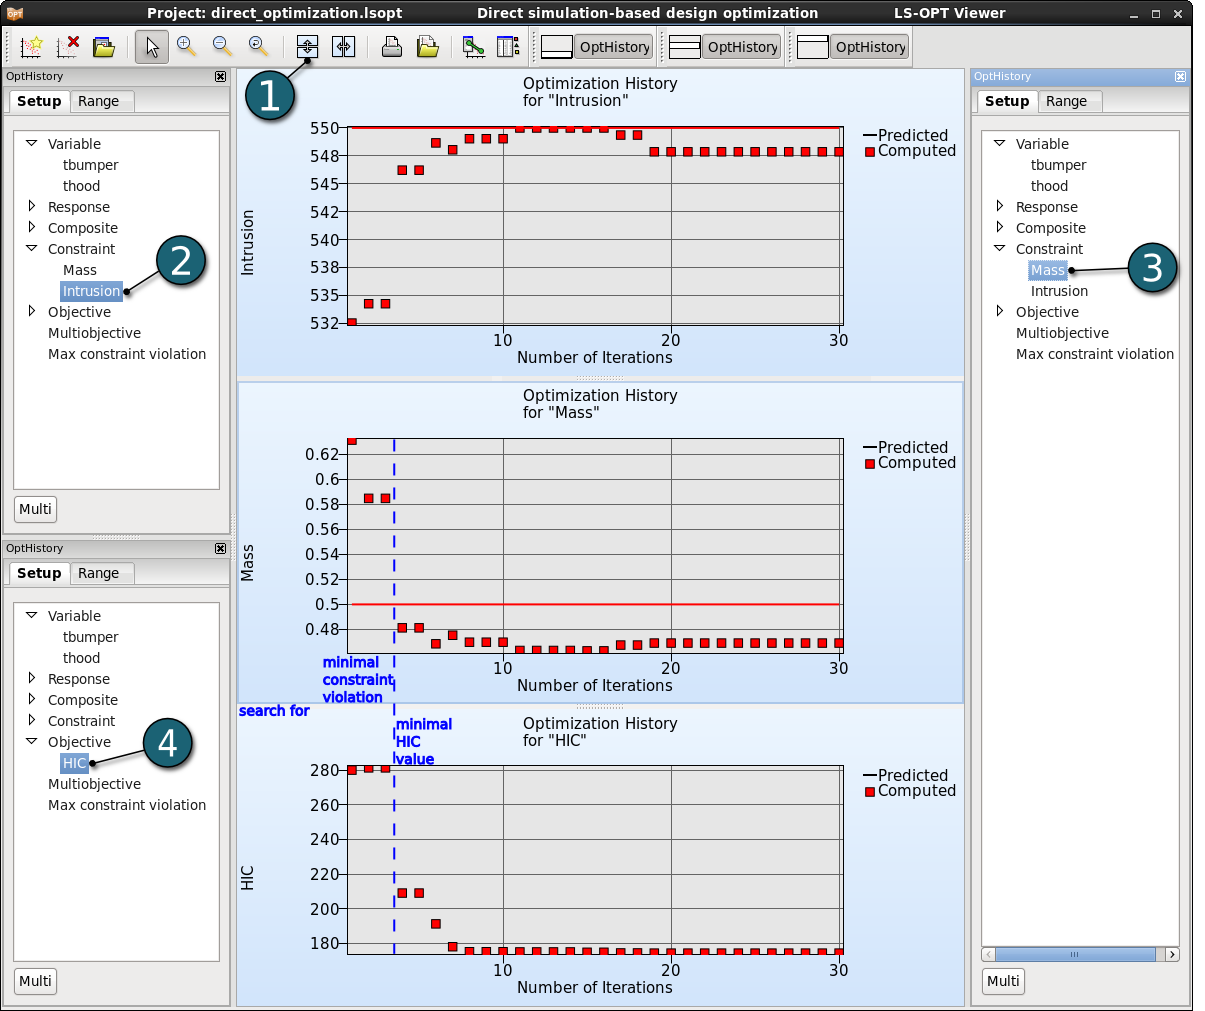
- Click twice on the Split vertical button to display the three plots in the same window, i.e. two constraints and one objective of the problem. Since the split window function splits the selected plot in the middle, we need to resize each plot equally in vertical sense for the sake of clear appearance.
- Select the constraint Intrusion in the Setup dialog of the first plot.
- Select the constraint Mass in the Setup dialog of the second plot.
- Select the objective HIC in the Setup dialog of the third plot.
- In these plots we can clearly see the optimization approach of the genetic algorithm as mentioned in the previous Scatter Plot section.
- As the constraint Mass is violated until the fourth iteration, the main purpose in the first four iterations is to minimize the maximal constraint violation. Until then the objective of the problem (HIC) has not been paid attention.
- Afer finding a feasible point, the objective HIC is going to be optimized, as displayed below.
For Linux : direct_optimization.tar.gz (29.2 kB)
For Windows : direct_optimization.zip (30.2 kB)
